![]()
![]()
| Related Topics: | ||
![]()
This topic describes how to use the Weibull++ standard folio control panel to perform life data analysis. It includes the following sections:
For a description of the parameter estimation methods and other additional settings, see Standard Folio Analysis Settings.
Life data analysis involves careful planning and requires many tasks. To make things easy to find, the standard folio control panel is arranged into groups of related tasks. Each group has its own page on the control panel.
Tip: There is a horizontal splitter bar directly above the Main button. If you drag it as far up as it will go, all of the pages of the panel will be accessed by large buttons. If you drag it all the way down, all of the pages will be accessed by small icons. Positions in between allow you to use some large buttons and some small icons. See Control Panels.
The Main page is probably where you will spend most of your time because it contains most of the tools you would need to analyze a data set. This includes:
The Distribution drop-down list, which is used to select the statistical distribution that will be used to model the data set.
The Analysis Settings area, which contain the options for estimating the parameters that best fit the distribution and the given data set.
The Analysis Summary area, which displays the values of the parameters and other results you could use to evaluate how well the distribution fits the data.
The folio tools are arranged on the left side of the panel. Use these tools to manage data and experiment with the results of your analysis.
![]() Calculate estimates the parameters of the chosen distribution, based on the current data set and the specified analysis settings. This tool is also available by choosing Life Data > Analysis > Calculate.
Calculate estimates the parameters of the chosen distribution, based on the current data set and the specified analysis settings. This tool is also available by choosing Life Data > Analysis > Calculate.
![]() Plot creates a new sheet in the folio that provides a choice of applicable plot types. For standard folios, this includes plots such as reliability vs. time, failure rate vs. time, probability plot, etc. This tool is also available by choosing Life Data > Analysis > Plot.
Plot creates a new sheet in the folio that provides a choice of applicable plot types. For standard folios, this includes plots such as reliability vs. time, failure rate vs. time, probability plot, etc. This tool is also available by choosing Life Data > Analysis > Plot.
![]() QCP opens the Quick Calculation Pad, which allows you to calculate results based on the analyzed data sheet, such as the probability of failure, mean life, etc. This tool is also available by choosing Life Data > Analysis > Quick Calculation Pad.
QCP opens the Quick Calculation Pad, which allows you to calculate results based on the analyzed data sheet, such as the probability of failure, mean life, etc. This tool is also available by choosing Life Data > Analysis > Quick Calculation Pad.
![]() Distribution Wizard pens the Distribution Wizard, which helps you select the distribution that best fits your data based on the selected parameter estimation method (i.e., RRX, RRY or MLE). This tool is also available by choosing Life Data > Analysis > Distribution Wizard.
Distribution Wizard pens the Distribution Wizard, which helps you select the distribution that best fits your data based on the selected parameter estimation method (i.e., RRX, RRY or MLE). This tool is also available by choosing Life Data > Analysis > Distribution Wizard.
![]() Alter Data Type opens the Weibull++ Folio Data Sheet Setup window, which allows you to change the data entry columns in the current data sheet. Note that when you change the setup, you may lose information already entered in the data sheet. For example, switching the data sheet from one that supports interval data to one that supports only right censored data will remove all the inspection times. This tool is also available by choosing Life Data > Format and View > Alter Data Type.
Alter Data Type opens the Weibull++ Folio Data Sheet Setup window, which allows you to change the data entry columns in the current data sheet. Note that when you change the setup, you may lose information already entered in the data sheet. For example, switching the data sheet from one that supports interval data to one that supports only right censored data will remove all the inspection times. This tool is also available by choosing Life Data > Format and View > Alter Data Type.
![]() Change Units opens the Change Units window, which allows you to change the time units of an existing data sheet.
Change Units opens the Change Units window, which allows you to change the time units of an existing data sheet.
![]() Auto Group Data opens the Auto Group Data window, which allows you to group together data points with the same failure/suspension times. Grouping data significantly speeds up calculations when you have a very large data set. This tool is also available by choosing Life Data > Options > Auto Group Data.
Auto Group Data opens the Auto Group Data window, which allows you to group together data points with the same failure/suspension times. Grouping data significantly speeds up calculations when you have a very large data set. This tool is also available by choosing Life Data > Options > Auto Group Data.
![]() Alter Parameters allows you to alter the values of the calculated parameters, assuming that the ranks, the likelihood function and the Fisher Matrix (evaluated at the original parameter estimates) remain the same. In plots, the position of the data points remain the same but the solution line and all subsequent analyses made via the QCP and other tools are based on the modified parameter values. Therefore, the analysis may be appropriate only within the context of your specific scenario. This tool is also available by choosing Life Data > Options > Alter Parameters.
Alter Parameters allows you to alter the values of the calculated parameters, assuming that the ranks, the likelihood function and the Fisher Matrix (evaluated at the original parameter estimates) remain the same. In plots, the position of the data points remain the same but the solution line and all subsequent analyses made via the QCP and other tools are based on the modified parameter values. Therefore, the analysis may be appropriate only within the context of your specific scenario. This tool is also available by choosing Life Data > Options > Alter Parameters.
![]() Specify Points opens the Specify Points window, which allows you to adjust the way that the line is fitted to the points for a rank regression analysis. The ranks will be calculated based on all of the data points but the regression line will be fitted only to the points you have specified. This tool is also available by choosing Life Data > Options > Specify Points.
Specify Points opens the Specify Points window, which allows you to adjust the way that the line is fitted to the points for a rank regression analysis. The ranks will be calculated based on all of the data points but the regression line will be fitted only to the points you have specified. This tool is also available by choosing Life Data > Options > Specify Points.
![]() Color Data Values allows you to apply different font colors to the entries in the data sheet for easy visualization. The following commands are available:
Color Data Values allows you to apply different font colors to the entries in the data sheet for easy visualization. The following commands are available:
Default Color applies a black font color to all the entries in the data sheet
Based on Data Type applies different font colors based on the type of censoring. The colors are: red for failure data (no censoring), green for suspension data, magenta for left-censored data and blue for interval data.
Based on Subset ID 1 applies different font colors based on unique subset IDs in the Subset ID 1 column. If a data point has no entry in the Subset ID 1 column, then the font color is black.
Based on Subset ID 2 applies different font colors based on unique subset IDs in the Subset ID 2 column. If a data point has no entry in the Subset ID 2 column, then the font color is black.
Based on Subset ID Combination applies font colors based on unique combinations of subset IDs in the Subset ID 1 and Subset ID 2 columns. If a data point has no subset IDs, the font color is black, but if a data point has at least one subset ID, then it is treated as having a unique combination of subset IDs.
Note that whenever you edit or add new data to the data sheet, you must choose one of the Color Data Values commands again in order to apply the correct font colors.
![]() Batch Auto Run opens the Batch Auto Run window, which allows you to quickly extract data from an existing data set based on the subset ID. This tool is also available by choosing Life Data > Options > Batch Auto Run.
Batch Auto Run opens the Batch Auto Run window, which allows you to quickly extract data from an existing data set based on the subset ID. This tool is also available by choosing Life Data > Options > Batch Auto Run.
The first step is to select a life distribution. In life data analysis, distributions are used to model the failure behavior of a product. Any distribution can be used to analyze a data set; however, if the distribution does not match the expected failure rate behavior of the product, the accuracy of the predictions will be compromised.
On the Main page of the control panel, select a distribution from the drop-down list. There are nine distributions and three special analysis methods to choose from:
The nine distributions are Weibull, exponential, lognormal, normal, generalized gamma, gamma, logistic, loglogistic and Gumbel. The ReliaWiki resource portal has information on the statistical characteristics of each distribution at: http://www.ReliaWiki.org/index.php/Life_Distributions.
Tip: If you are not certain which distribution would provide the best fit for your data, you can use the Distribution Wizard to guide you through the selection process.
The special analysis methods are:
Mixed Weibull analysis is used for analyzing data sets that reflect different trends in the failure behavior. This method may be useful when dealing with failure modes that cannot be assumed to be independent (i.e., the occurrence of one failure mode affects the probability of occurrence of the other mode) and/or when it is not possible to identify the failure mode responsible for each individual data point. To use mixed Weibull analysis, you will need to specify how many subpopulations exist in the data set (2, 3 or 4). The software will determine the proportion of units that fall under each subpopulation, and calculate the Weibull parameters of those subpopulations. The overall reliability of the full data set is then computed by obtaining the sum of the proportional reliability contributions of each subpopulation.
Bayesian-Weibull analysis is based on the concepts of Bayesian statistics. It is typically used in situations when you have a small sample size and a strong prior knowledge of what the failure behavior is likely to be.
Competing Failure Modes (CFM) analysis is used for analyzing data sets that contain failures due to different types of failure modes. The occurrence of one failure mode results in a failure for the product; hence, the failure modes are said to “compete” to cause the failure. This analysis can be used when the failure modes are assumed to be statistically independent (i.e., the occurrence of one failure mode does not affect the probability of occurrence of the other mode) and when the failure mode responsible for each failure can be clearly identified. To use CFM analysis, you will need to categorize the times in the data set according to failure modes and then choose one type of life distribution to model the failure behavior of each mode separately. The overall reliability is computed by obtaining the reliability due to each failure mode and then multiplying together the reliability values.
The next step is to select the analysis settings. The Analysis Settings area on the Main page of the control panel provides a quick summary of the settings that will be used to fit the distribution. Click the options displayed in blue text on the control panel to toggle between the available options. The following table serves as a guide to the abbreviations. Note that the available options will vary depending on the data type, distribution and analysis method you have selected.
| Analysis Method | Rank Method |
| Rank Regression on X (RRX) | Standard Ranking Method (SRM) |
| Rank Regression Y (RRY) | ReliaSoft Ranking Method (RRM) |
| Non-Linear Rank Regression (NLRR) | |
| Maximum Likelihood Estimation (MLE) | |
| Confidence Bounds Method | Rank Method |
| Fisher Matrix Confidence Bounds (FM) | Median Ranks (MED) |
| Bayesian Confidence Bounds (BSN) | Kaplan-Meier Estimator (K-M) |
| Beta-Binomial Confidence Bounds (BB) |
These settings are also available on the Analysis page of the control panel. See Standard Folio Analysis Settings for a description of these settings.
Finally, calculate the parameters of the chosen life distribution by choosing Life Data > Analysis > Calculate or by clicking the Calculate icon on the Main page of the control panel.
![]()
The control panel will display the calculated results in the Analysis Summary area of the control panel. The following example shows the calculated parameters of a Weibull distribution for a particular data set.
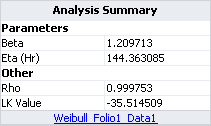
Click anywhere within the Analysis Summary area to open the Results window, which displays the calculated results in a worksheet. From the Results window, you can edit, copy or print the results.
Note: If the distribution and parameters are associated with a published model, then the model's name will appear as a link at the bottom of the Analysis Summary area. Click the link to view the model's properties. For details on how to publish the results as a model, see Control Panel Publishing page.
Because the calculated parameters are estimates based on observed data points from a limited sample size, there is uncertainty in the results. Therefore, in addition to displaying the calculated parameters, the control panel also returns other results that may be used to evaluate how well the chosen distribution or analysis method fits the data set. Depending on your application settings, the following information may be displayed:
The Rho value (correlation coefficient) is automatically calculated and displayed in the results if the parameters were estimated using rank regression. Rho is a measure of how well the regression line falls onto a straight line on a probability plot. The closer the value of rho is to +/-1, the better the linear fit. A value of zero would indicate that the data points are randomly scattered and have no pattern or correlation to the regression line model.
The LK Value (likelihood function value) is automatically calculated and displayed in the results regardless of the chosen analysis method. The LK value is the peak value of the likelihood function, at the estimated parameter values. It is influenced by the sample size and the variability of the data set. This means that the LK value varies across different data sets and cannot be used by itself to make a judgment about the fit of the distribution. However, this value becomes useful when it is used to compare how different distributions fit a particular data set. For a given set of data, the distribution with the highest LK value is considered to have the best fit statistically. To view a plot of the likelihood surface, see 3D Plots.
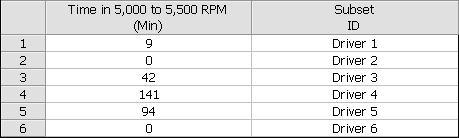
If the data set contains failures at time = 0, the calculation for the Pnz (percent non-zero) will be automatically displayed in the results. Pnz represents the proportion of the population with non-zero failure times. For example, an automotive manufacturer may be interested in how customers use their vehicles' engines with respect to engine speed. To measure this, they capture the amount of time the engines spend in certain RPM bands (0 to 500 RPM, 500 to 100 RPM, etc.). A problem occurs when measuring the higher RPM bands because some drivers might never spend time in higher RPM speed bands. This results in a data set that contains a certain number of zero data points, as shown next. For this example, the value of Pnz would be approximately 67% (i.e., 1 - (2/6) = 0.66).
The software calculates the parameters of the distribution without the zeroes; however, the reliability, unreliability and probability density calculations of the entire data set are influenced by the value of Pnz such that:
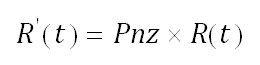
where R’(t) is the reliability function for the entire data set and R(t) is the reliability function for the data set without the zeroes. Conditional reliability and failure rate functions are not affected.
If you use the 3-parameter Weibull distribution, you have the option to display the theta parameter, which is the sum of the values of the eta and gamma parameters. To include the theta parameter in the results, select the Show Theta check box on the Weibull++ Folios page of the Application Setup. Note that for the 1-parameter and 2-parameter Weibull distributions, the value of gamma is zero; therefore, if you select to display theta for these distributions, the value of theta will be identical to the value of eta.
As an alternative, you can select to always display the theta parameter instead of eta. To do this, click the Calculations page of the Application Setup and select the Use Theta parameter scheme on Weibull check box.
The following tools may also be used in conjunction with your own engineering knowledge about the model in order to evaluate the fit of the distribution to the data set.
For a rank regression analysis, the Probability Plot shows you how well the solution line tracks the plotted data points. This allows you to visually assess the fit of a distribution. This method can be used only when the parameters have been calculated using rank regression.
Confidence Bounds allow you to quantify the amount of uncertainty in the parameter estimates and in the reliability predictions due to sampling error. The narrower the confidence bounds, the closer the estimates are to the true value of the parameters and the better the precision on the reliability predictions. You can visualize the confidence bounds by using plots or obtain point calculations on the confidence bounds by using the Quick Calculation Pad.
The Goodness of Fit Results is a utility that uses three different tests to determine how well the parameters of the distribution fit the data. Note that this utility can only be used to evaluate data sets that do not contain censored data.
© 1992-2013. ReliaSoft Corporation. ALL RIGHTS RESERVED.