![]()
![]()
| Related Topics: | ||
The Analysis page of the Weibull++ standard folio control panel includes the settings that are also displayed on the Main page, along with any additional settings that may be applicable for the current data sheet. This topic provides a brief description of all the settings. For the background theory of each analysis method, the ReliaWiki resource portal provides more information at: http://www.ReliaWiki.org/index.php/Parameter Estimation.
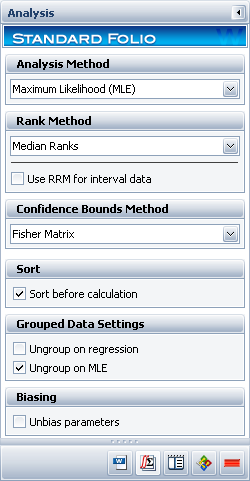
The Analysis page includes the following settings:
The Analysis Method setting allows you to choose the method for estimating the parameters of your chosen distribution. There are four options to choose from: rank regression on X (RRX), rank regression on Y (RRY), non-linear rank regression (NLRR) and maximum likelihood estimation (MLE). Note the following:
For free-form data, the only analysis methods available are RRX and RRY.
The NLRR method is available only when you choose the 3-parameter Weibull distribution.
As a rule of thumb, data sets with small sample sizes and mostly complete data may be best analyzed with rank regression, while MLE may be more appropriate for data sets with a high proportion of suspensions, interval data or many observed failures. This is because the MLE method is based on the likelihood function, which considers each time-to-suspension in the estimate of the parameters, unlike in rank regression where the solution is based on the plotting positions of the times-to-failure data. However, the MLE solution tends to be badly biased (statistically distorted) when performed on small sample sizes. As the sample size gets larger, the difference between the two methods become less important. To determine whether your sample size is large enough for MLE, you will need to take into account factors such as the amount of variability in your data set and the acceptable level of risk or margin of error in your calculations. For more information on rank regression vs. the MLE parameter estimation method, please read "Comparison of MLE and Rank Regression Analysis When the Analysis Contains Suspensions" at: http://www.Weibull.com/hotwire/issue16/relbasics16.htm
When choosing between rank regression on X (RRX) and rank regression on Y (RRY), note that data are best analyzed when regressed in the direction of uncertainty. For example, in reliability tests, the times-to-failure (x-axis) vary from test to test but the probabilities of failure (y-axis) remain consistent. Therefore, if the uncertainty is on the times-to-failure data, RRX may be the preferred analysis method.
On the other hand, in situations where the time value (x-axis) is known but the probability of failure (y-axis) varies for each time value, the RRY method may be the appropriate choice because the uncertainty is on the unreliability estimates.
The Rank Method setting allows you to choose the method for calculating the unreliability estimates of the times-to-failure data. There are two options available: median ranks and the Kaplan-Meier estimator.
The median ranks method assigns unreliability estimates based on the failure order number and the cumulative binomial distribution. Alternatively, the Kaplan-Meier estimator uses the product of the surviving fractions, producing a modified empirical distribution. In general, the median ranks method is preferable and more widely used for unreliability estimation. Thus, it is a good idea to use the median ranks method unless one has a specific reason to use the Kaplan-Meier methodology.
The Use RRM for interval data check box is for the ReliaSoft ranking method (RRM). This option is automatically selected when you have interval censored data in the data sheet; otherwise, the software will use the default standard ranking method (SRM). The RRM method provides a more accurate estimate of the time the failure occurred in the interval by iteratively recomputing the failure times and the ranks until the parameter values converge. For non-interval data (exact times-to-failure data) there is no difference in the results between the SRM and RRM methods. The ReliaWiki resource portal provides more information on the RRM method at: http://www.ReliaWiki.org/index.php/ReliaSoft's Alternate Ranking Method.
The Confidence Bounds Method setting allows you to choose the method for calculating the confidence bounds. The methods available depend on your chosen distribution method or analysis method. Note that confidence bounds calculations are not available for free-form data. The ReliaWiki resource portal provides more information on the background theory of confidence bounds at: http://www.ReliaWiki.org/index.php/Confidence Bounds.
The Fisher Matrix method is the standard way of calculating confidence bounds, and it is the default method in the software. For data sets with a large number of data points, there is no significant difference in the results between the Fisher Matrix method and the likelihood ratio method; however, when working with very small sample sizes, the Likelihood Ratio method may be more accurate.
The Bayesian method calculates the confidence bounds by analyzing prior information about the assumed distribution’s parameters along with sample data in order to evaluate the amount of uncertainty in the estimated values. This method is available only when you choose the MLE analysis method or the Bayesian-Weibull distribution.
The Beta-Binomial method is a non-parametric approach to confidence bounds calculations, meaning that no underlying distribution is assumed. This method can be used only with the mixed Weibull distribution.
The Sort before calculation option allows you to sort the failure/suspension times in the data sheet in ascending order. This will not affect the results of the calculation because, in the standard folio, all data points are assumed to be independent and identically distributed (i.i.d.).
The Grouped Data Settings affect how the unreliability estimates (median ranks or Kaplan-Meier estimates) are plotted on the probability plot. These settings are available only when working with grouped data.
When using rank regression with grouped data, the software will plot only the data points that correspond to the highest median rank position in each group. For example, for 2 groups of data with 10 units each, the software will plot only 2 data points: the 10th rank position out of 20, and the 20th rank position out of 20. The regression line is then fitted to these 2 points. When you select the Ungroup on regression check box, the software will plot each individual data point in the group. The regression line is then fitted to all the data points. In general, grouped data analysis provides parameter estimates that have wider confidence bounds, while ungrouped data analysis provides parameter estimates with much narrower confidence bounds. The ReliaWiki resource portal provides more information about using rank regression with grouped data at: http://www.ReliaWiki.org/index.php/Grouped Data Parameter Estimation.
When using MLE analysis, the Ungroup on MLE check box ungroups the data during calculations and then plots all the data points in each group on the probability plot; however, the solution of the line is obtained from the likelihood function and not by the plotting positions of the data points. Therefore, the line is not expected to track the points on the plot. This option is useful for adjusting the way the grouped data points are displayed on the MLE probability plot.
Note: When working with grouped interval censored data, you have to be cautious about ungrouping the data. In interval censored data, it is assumed that the failures occur at some time in the interval between the previous and the current time-to-failure. For example, a group of 10 units may be interval censored between zero and 100 hours. If you select the Ungroup on Regression check box, the software will treat the 10 units as failures that occur at exactly 100 hours.
The Biasing option is available when you select the 2-parameter Weibull distribution with MLE analysis, and only if the Bayesian confidence bounds method is not selected. The MLE method is known to obtain biased (statistically distorted) estimates when performed on small sample sizes. The Unbias parameters check box corrects the biased estimate of the Weibull beta parameter due to the MLE sampling error. Weibull++ uses the correction factor proposed by Ross and Hirose to unbias both censored and non-censored data. The ReliaWiki resource portal provides more information about the correction factors at: http://www.ReliaWiki.org/index.php/The_Weibull_Distribution#Unbiased_MLE.
For more information about how you might correct biased estimates, please read "Unbiasing Parameters in Weibull++" at: http://www.Weibull.com/hotwire/issue109/relbasics109.htm. (Note that this article uses Weibull++ 7, but the theory remains the same.)
© 1992-2013. ReliaSoft Corporation. ALL RIGHTS RESERVED.