![]()
![]()
| Related Topics: | ||
![]()
Degradation analysis is a technique that uses the performance (degradation) measurements of a product over time to predict the point at which each unit in the sample is expected to fail. This analysis is useful for tests performed on products with very high reliability, where it is not possible to test the units to failure under normal conditions. ALTA degradation analysis uses accelerated stress levels during testing to further reduce the test time required to obtain the predicted failure times. The predicted failure times are failures that would occur under these accelerated stress levels.
After the failure times under accelerated stresses are extrapolated, the ALTA degradation analysis folio will automatically perform an accelerated life testing data analysis on those failure times. This allows you to obtain the life characteristics of the product at normal operating conditions.
This topic includes the following sections:
To add an ALTA degradation analysis folio to an existing project choose Insert > Folios > ALTA Degradation Folio or right-click the Specialized Folios folder in the current project explorer and choose Add ALTA Degradation on the shortcut menu.
![]()
The setup window is used to do the following:
Determine the number of stress columns to be used in your degradation folio's data sheet by selecting or clearing the various check boxes.
Every stress column represents a stress type. So, for example, a data sheet with two stress columns would be used for data obtained from a two-stress test.
Change the labels for each stress column by changing the text under the Stress Name and Stress Units headings. There is a preview table at the bottom of the window that shows you how the names of the associated columns that will appear in the data sheet.
Note: The Stress Name and Stress Units fields are merely for adding text to the headers of the stress columns, so you can keep track of which stress type is associated with each stress column. This information is not relevant to the software’s calculations.
Define the stress level of each stress that is expected for normal use conditions by entering values under the Use Level heading.
After you configure your folio, click OK in the setup window to create and view it.
Each row in the ALTA degradation analysis data sheet is a degradation measurement for a specified test unit at a given stress level. For example, the following shows data for two LED units, A1 and A2, whose light intensity was inspected every 50 hours.
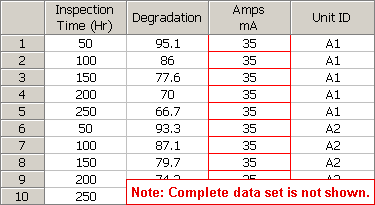
The Inspection Time column indicates the time at which the degradation of the unit was measured. Time may also be measured as the amount of usage the sample accumulates or as the factor that degrades the unit. The level of degradation may be measured either continuously or at predetermined intervals of time.
The Degradation column indicates the degradation measurement of a unit (in this case, measured in mcd).
Note that in some cases, measuring the level of degradation is not possible without invasive techniques or destroying the specimen. In those situations, the degradation may be measured through a performance indicator, such as the luminosity of a bulb (as in this example) or resistance of a dielectric.
The Amps column indicates the stress type and level (in this case, measured in mA) of the unit being tested.
The Unit ID column indicates the unit being measured. The software extrapolates the failure time for each unique unit based on its degradation measurements.
The ALTA degradation folio control panel is arranged into sections of related tasks. Each group has its own page on the control panel.
Tip: There is a horizontal splitter bar directly above the small icons at the bottom of the control panel. If you drag it as far up as it will go, all of the pages of the panel will be accessed by large buttons. If you drag it all the way down, all of the pages will be accessed by small icons. Positions in between allow you to use some large buttons and some small icons. See Control Panels.
The Degradation Model area includes a drop-down list you must use to select a mathematical model. This model will be used to extrapolate the times at which the critical degradation level would be reached for each unique unit ID in the data sheet. The following is a list of all available models and their corresponding equations. The variable x represents the failure time, y represents the critical degradation, and variables a, b and c are the model parameters to be solved for in the extrapolation.
Linear: y = a*x+b
Exponential: y = b*exp(a*x)
Power: y = b*(x^a)
Logarithmic: y = a*ln(x)+b
Gompertz: y = a*b^(c^x)
Lloyd-Lipow: y = a-b/x
Tip: If you are not certain which degradation model would provide the best fit for your data, you can use the Degradation Model Wizard to guide you through the selection process.
The Critical Degradation field allows you to define the level of degradation that is considered a failure. For example, you might wish to define failure as the time when the depth of a tire tread is less than 2 millimeters.
Suspend After allows you to define a censoring time past which no failure times are extrapolated. In practice, there is usually a rather narrow band in which the censoring time has any practical meaning. If the censoring time is relatively low, no failure times will be extrapolated, which defeats the purpose of the degradation analysis. On the other hand, a relatively high censoring time would occur after all of the theoretical failure times, thus rendering the censored data meaningless. Nevertheless, certain situations may arise in which it is beneficial to censor the degradation data. For example, if your product has a maximum warranty life of 10,000 hours, then you may want to treat all failures beyond that time as suspensions.
The ALTA Model area contains the settings for performing accelerated life testing data analysis on the failure times that were extrapolated via the degradation analysis. These settings have no effect on the degradation analysis calculations; they only affect the accelerated life testing analysis calculations. The settings in this area are identical to the settings on the control panel of an ALTA standard folio, except for the following option.
The Use extrapolated intervals option extrapolates the failure/suspensions times as interval censored data. The intervals are calculated as bounds around the extrapolated data points.
What's Changed? In previous versions of ALTA, you used the Associate Specialized Folio tool to transfer the extrapolated data points to an ALTA standard folio data sheet in order to perform accelerated life testing data analysis. In version 8, you can conveniently perform this analysis within the ALTA degradation analysis folio.
When you click the Calculate icon on the control panel, the software extrapolates the points at which the degradation measurements will reach the point of critical degradation. It then performs a separate accelerated life testing analysis on the extrapolated points based on the settings you have specified in the ALTA Model area.
The Degradation Results area allows you to display the parameters of the chosen degradation model and the extrapolated failure/suspension times. Click the Degradation Results (...) button to open the Results window, which allows you to view, edit and print the calculations.
The ALTA Results area allows you to display the parameters of the model that combines your selected life distribution and life-stress relationship. Click the ALTA Results (...) button to open the Results window.
Note: If the model and parameters are associated with a published model, then the published model's name will appear as a link at the bottom of the Analysis Summary area. Click the link to view the model's properties. For details on how to publish the results as a model, see Control Panel Publishing page.
The folio tools are arranged on the left side of the panel. Use these tools to manage data and experiment with the results of your analysis.
![]() Calculate extrapolates
the times at which the degradation will reach the critical degradation
level (i.e., the times at which the degradation is serious enough that
the unit is considered to be failed). The software then performs accelerated
life testing analysis calculations on the extrapolated data points. This
tool is also available by choosing Degradation
> Analysis > Calculate.
Calculate extrapolates
the times at which the degradation will reach the critical degradation
level (i.e., the times at which the degradation is serious enough that
the unit is considered to be failed). The software then performs accelerated
life testing analysis calculations on the extrapolated data points. This
tool is also available by choosing Degradation
> Analysis > Calculate.
![]() Plot
creates a new sheet in the folio that provides a choice of applicable
plot types. This includes the degradation vs. time plot in addition
to the ALTA plots. This tool is also
available by choosing Degradation >
Analysis > Plot.
Plot
creates a new sheet in the folio that provides a choice of applicable
plot types. This includes the degradation vs. time plot in addition
to the ALTA plots. This tool is also
available by choosing Degradation >
Analysis > Plot.
![]() QCP
opens the Quick
Calculation Pad, which allows you to calculate accelerated life testing
analysis metrics, identical to the calculations you can perform in an
ALTA standard folio. This tool is also available by choosing Degradation
> Analysis > QCP.
QCP
opens the Quick
Calculation Pad, which allows you to calculate accelerated life testing
analysis metrics, identical to the calculations you can perform in an
ALTA standard folio. This tool is also available by choosing Degradation
> Analysis > QCP.
![]() Degradation Model Wizard
opens the Degradation Model Wizard,
which helps you select the degradation model that best fits your data.
This tool is also available by choosing Degradation
> Analysis > Model Wizard.
Degradation Model Wizard
opens the Degradation Model Wizard,
which helps you select the degradation model that best fits your data.
This tool is also available by choosing Degradation
> Analysis > Model Wizard.
![]() Distribution Wizard
opens the Distribution Wizard, which helps you select the life distribution
that best fits the data set. In the degradation folio, the ranking in
the Distribution Wizard is based on the life distribution included in
the selected ALTA model. This tool is also available by choosing Degradation > Analysis > Distribution
Wizard.
Distribution Wizard
opens the Distribution Wizard, which helps you select the life distribution
that best fits the data set. In the degradation folio, the ranking in
the Distribution Wizard is based on the life distribution included in
the selected ALTA model. This tool is also available by choosing Degradation > Analysis > Distribution
Wizard.
![]() Add or Remove Columns
allows you to add/remove columns
for stress levels and unit IDs.
Add or Remove Columns
allows you to add/remove columns
for stress levels and unit IDs.
![]() Change Units opens
the Change Units window, which allows you
to change the units for the time values in the current data sheet.
Change Units opens
the Change Units window, which allows you
to change the units for the time values in the current data sheet.
© 1992-2013. ReliaSoft Corporation. ALL RIGHTS RESERVED.