![]()
![]()
Weibull++ and ALTA provide two tools designed for statistical comparison of data sets:
The Life Comparison tool calculates the probability that the times-to-failure of one population will be better or worse than the times-to-failure of the second. This allows you to compare life distributions from two alternate designs, manufacturers, lots, assembly lines, etc. in order determine whether the units in the first group will outlast the units in the second.
The Stress-Strength comparison tool allows you to determine the probability of failure based on the probability of stress exceeding strength. The strength data set could be actual data that represents the strength of the material (i.e., minimum applied stress to cause failure) and the stress data set could be the actual stress levels that the material will experience under use conditions.
Both tools are based on the same underlying probability equation, and both folios function in a similar way. This topic describes them both in the following sections:
For examples of analyses, see Life Comparison Example and Stress-Strength Comparison Example.
What's Changed? In previous versions of Weibull++ and ALTA, the results of the tests were not saved to a folio. In Version 8, the software now creates a folio for saving your results and also provides a plot for visualizing the resulting probability function. The folio is saved under the Tools heading in the current project explorer.
To add a life comparison folio to a project, choose Insert > Tools > Life Comparison or right-click the Tools folder in the current project explorer and choose Add Life Comparison on the shortcut menu.
![]()
To add a stress-strength folio to a project, choose Insert > Tools > Stress-Strength or right-click the Tools folder in the current project explorer and choose Add Stress-Strength on the shortcut menu.
![]()
When you add the folio to a project, you will be asked to select two data sheets to compare. Note that the data sheets must have already been analyzed (i.e., the parameters of the distribution have been calculated) in order for you to select them.
After you select the data sheets, the software will automatically plot the distributions of the data sets and estimate the probability value. You can then use the control panel settings in the folio to perform additional analyses or change how you want the probability value to be calculated.
The life comparison and stress-strength folios share the same control panel settings. The following picture shows the control panel of a stress-strength folio. The icons arranged vertically on the left side of the panel allow you to perform a variety of tasks related to the comparison (e.g., calculate the folio, select different data sheets, etc.), while the icons arranged horizontally perform tasks for each data set. All the control panel icons are described below.
The Analysis page includes the following settings:
The Results area shows the calculated probability value.
In the life comparison folio, the value represents the probability that the life of the second data set exceeds the life of the first data set (Probability X1<X2).
In stress-strength folio, the value represents the Reliability of the product (i.e., the probability that the product can withstand the applied stress). This can also be displayed as the Probability of Failure if you select the check box on the Setup page.
To display a report of the results, click the Show Results (...) button. The Results window allows you to edit, copy or print the results.
Select the Calculate Confidence check box if you want to compute the two-sided confidence bounds of the probability value. Enter a decimal in the Level field. The values will be displayed in the Upper Bound and Lower Bound fields after you recalculate the folio.
The following settings affect how the plot is displayed:
Select the Auto Refresh check box to automatically refresh the plot if any of the data sets, inputs or settings are modified
Select the Keep Aspect Ratio check box to maintain the ratio of the horizontal size to the vertical size of the plot graphic when you resize the plot sheet.
The Scaling area shows the minimum and maximum values for the X and Y axes. You can change these values if the Auto Scale check box beside the value range is cleared. If it is selected, the application will automatically choose appropriate values for the range based on the current data.
The control panel also displays the values of the parameters of the distribution for each data set. For the stress-strength comparison test (as shown in the picture), the first data set represents the Stress and the second data set represents the Strength. For the life comparison test, these are displayed as Set 1 and Set 2.
To see a summary report of the analysis for a data set, click anywhere within the parameters table.
To open the standard folio, click the blue link that displays the name of the folio and data sheet.
The folio tools include the following options:
![]() Calculate calculates the probability value.
Calculate calculates the probability value.
In the life comparison folio, the value represents the probability that the life of the second data set exceeds the life of the first data set (Probability X1<X2).
In stress-strength folio, the value represents the Reliability of the product (i.e., the probability that the product can withstand the applied stress). This can also be displayed as the Probability of Failure if you select the check box on the Setup page.
![]() Redraw Plot updates the plot to reflect any changes that have been made.
Redraw Plot updates the plot to reflect any changes that have been made.
![]() Plot Setup opens the Plot Setup window, which allows you to customize most aspects of the plot including the titles, line styles and point styles.
Plot Setup opens the Plot Setup window, which allows you to customize most aspects of the plot including the titles, line styles and point styles.
![]() RS Draw launches ReliaSoft Draw, which allows you to annotate your plot and view your plot in greater detail.
RS Draw launches ReliaSoft Draw, which allows you to annotate your plot and view your plot in greater detail.
![]() Export Plot Graphic opens the Save As window, which allows you to save the current plot graphic in one of the following formats: *.jpg, *.gif, *.png or *.wmf.
Export Plot Graphic opens the Save As window, which allows you to save the current plot graphic in one of the following formats: *.jpg, *.gif, *.png or *.wmf.
![]() Select Data Sheet opens a window that allows you to select the data sheets to compare.
Select Data Sheet opens a window that allows you to select the data sheets to compare.
![]() Target Reliability Parameter Estimator opens the Target Reliability Parameter Estimator window, which allows you to explore how you could attempt to change one of the distribution parameters in order to meet a specified target reliability. The plot and probability value will be based on the altered distributions and therefore may be appropriate only within the context of your specific scenario.
Target Reliability Parameter Estimator opens the Target Reliability Parameter Estimator window, which allows you to explore how you could attempt to change one of the distribution parameters in order to meet a specified target reliability. The plot and probability value will be based on the altered distributions and therefore may be appropriate only within the context of your specific scenario.
![]() Reliability Demonstration Test opens the Reliability Demonstration Test window, which allows you to solve for values associated with a specified test design, such as required test time, required sample size, demonstrated reliability and confidence level.
Reliability Demonstration Test opens the Reliability Demonstration Test window, which allows you to solve for values associated with a specified test design, such as required test time, required sample size, demonstrated reliability and confidence level.
![]() Alter Parameters allows you to alter the values of the calculated parameters, assuming that the ranks, the likelihood function and the Fisher Matrix (evaluated at the original parameter estimates) remain the same. The plot and probability value will be based on the modified parameters, and therefore may be appropriate only within the context of your specific scenario.
Alter Parameters allows you to alter the values of the calculated parameters, assuming that the ranks, the likelihood function and the Fisher Matrix (evaluated at the original parameter estimates) remain the same. The plot and probability value will be based on the modified parameters, and therefore may be appropriate only within the context of your specific scenario.
![]() Refresh Parameters if you have manually modified the parameters of the data set, this option allows you to revert to the parameters calculated from the original data source.
Refresh Parameters if you have manually modified the parameters of the data set, this option allows you to revert to the parameters calculated from the original data source.
![]() Transfer Parameters allows you to transfer those modified parameters to the original data source. All subsequent analysis made on the data source, such as calculations made via the QCP and other tools, are based on the modified parameter values. Therefore, the analysis may be appropriate only within the context of your specific scenario.
Transfer Parameters allows you to transfer those modified parameters to the original data source. All subsequent analysis made on the data source, such as calculations made via the QCP and other tools, are based on the modified parameter values. Therefore, the analysis may be appropriate only within the context of your specific scenario.
The Setup page contains options for setting how you want the probability value to be computed. The following picture shows the Setup page of a stress-strength folio.
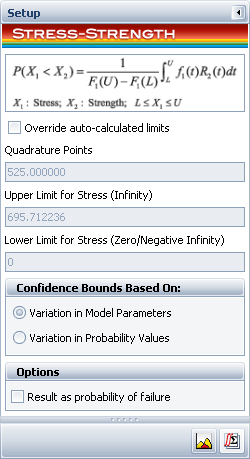
The default limits of the integral are from zero to infinity. You can change the limits by selecting the Override auto-calculated limits check box. The ability to change the upper and lower limits of the integral gives you the option to limit your analysis to specific areas of interest.
When you use a finite upper limit, the test excludes the outcomes where both products are expected to operate longer than the time specified by the upper limit.
When you specify a lower limit, the test excludes the outcomes where both products are expected to fail before the time specified by the lower limit.
For example, you might wish to set the lower limit to a time other than zero in order to exclude the burn-in period from the comparison. Likewise, you could set a specific time for the upper limit if you want to consider only the behavior that occurs while the product is under warranty.
The Quadrature Points field allows you to set the number of intervals (evaluation points) that the integral is divided into. Increasing the quadrature points increases the accuracy of the approximation but at the expense of increased calculation time.
For more information about how the limits of the integral affect the calculations, please read "Truncation of the Integral Used in the Comparison Wizard in Weibull++" at: http://www.weibull.com/hotwire/issue125/relbasics125.htm. (Note that this article uses Weibull++ 7, but the theory remains the same.)
Additional options are also available:
Confidence Bounds Based On: The comparison tools provide two methods for calculating the confidence bounds, depending on the information available for the distributions that are being compared. (Note that confidence bounds calculations are not possible when one or both data sheets is an ALTA standard folio that uses stress profiles.)
Variation in Model Parameters: If the parameters of both distributions are estimated from data, the software can estimate the uncertainties associated with these parameters. Therefore, the default method to calculate the variance and confidence bounds for a life comparison or stress-strength folio is based on the variation in the model parameters for both distributions. The calculated confidence bounds are for the expected probability.
Note that the "Variation in Model Parameters" option is not supported if one or both of the data sets meets any of the following conditions. In these cases, use the "Variation in Probability Values" option.
Has no data set.
Has parameters that were modified via the Alter Parameters tool or Target Reliability Parameter Estimator.
Is a free-form data sheet.
Does not use Fisher Matrix confidence bounds.
Is an ALTA standard folio that uses the cumulative damage model.
Variation in Probability Values: If the parameters of either distribution are fixed values, the uncertainties associated with the parameters are not known so an alternative method must be used to calculate the variance and confidence bounds. The alternative method is based on the variation in the probability values that would be calculated using the distribution for the first data set. The calculated confidence bounds are for the probability.
The ReliaWiki resource portal has more information on how the confidence intervals are calculated at: http://www.ReliaWiki.org/index.php/Stress-Strength_Analysis
Result as probability of failure: This setting is available only in stress-strength folios. It allows you to display the probability of failure instead of the reliability.
The life comparison test uses the following equation to evaluate the probability of failure based on the probability that the life of the second product is greater than or equal to the life of the first product [1]:
|
|
(1) |
where f(t) is the pdf of product 1 and R(t) is the reliability function of product 2. The evaluation is based on whether this probability is less than or greater than 0.5. The result is interpreted as follows:
If P = 0.5, then the lives of both products are equal.
If P > 0.5, then the life of product 2 exceeds the life of product 1. For example, if P = 0.8, then product 2 is better than product 1 with an 80% probability.
If P < 0.5, then the life of product 1 exceeds the life of product 2. For example, if P = 0.10, then product 1 is better than product 2 with a 90% probability (1 - 0.10 = 0.9).
For the stress-strength test, Eqn. (1) may be expressed as:
|
|
(2) |
The expected reliability is calculated as:
|
|
(3) |
For data sets that are calculated in an ALTA standard folio, the comparison is performed at the given use stress levels of both data sets; therefore, Eqn. (1) can also be expressed as:
|
|
(4) |
© 1992-2013. ReliaSoft Corporation. ALL RIGHTS RESERVED.


