![]()
![]()
| Related Topics: | ||
A product is being redesigned to improve its reliability. The following tables show the times-to-failure data of each design. The objective is to determine whether the redesign improved the product's reliability.
| 2 | 2 | 3 | 4 | 6 | 9 |
| 9 | 11 | 17 | 17 | 19 | 21 |
| 23 | 28 | 33 | 34 | 34 | 37 |
| 38 | 40 | 45 | 55 | 56 | 57 |
| 67 | 76 | 90 | 115 | 126 | 197 |
| 15 | 32 | 61 | 67 | 75 |
| 116 | 148 | 178 | 181 | 183 |
The first step in the analysis is to enter the data in two separate Weibull++ standard folio data sheets. Calculate the parameters for both data sheets by using the 2P-Weibull distribution and the RRX analysis method.
Next, add a life comparison folio to the project by choosing Insert > Tools > Life Comparison.
![]()
Select the data sheets for the two designs, as shown next. Click OK.
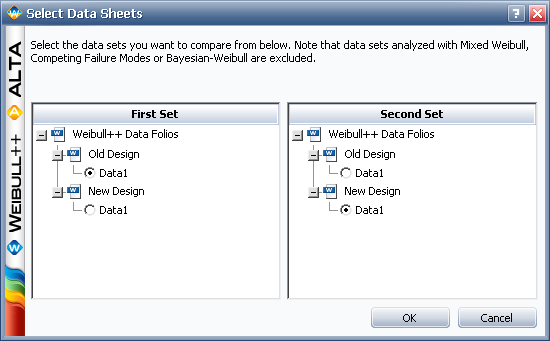
The result shows the following plot (with an area shaded to show the region where the life of the new design exceeds the life of the old design).
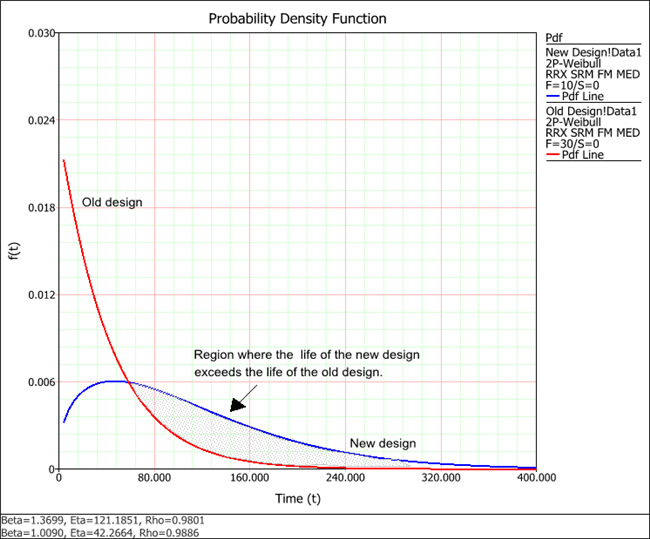
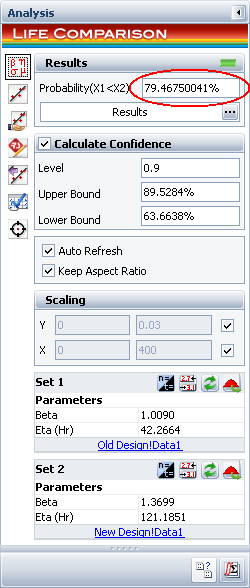
The result on the control panel indicates that the new design will last longer with a probability of 79.4675%, as shown next.
© 1992-2013. ReliaSoft Corporation. ALL RIGHTS RESERVED.