![]()
![]()
| Related Topics: | ||

Stress levels under test conditions and/or during normal use may vary with time. For example, an engineer may decide that each unit in a sample will be tested at 310 K for the first 10 hours of a test, 320 K for the next 10 hours, and 330 K for the remainder of the test. ALTA PRO allows you to define and save stress profiles that describe how stress levels will vary with time. When you select a cumulative damage model in the ALTA standard folio, all of the stress profiles validated in your project become available to describe use level stress conditions and stress conditions during testing.
Tip: The stress profile functionality is available only in ALTA PRO. If you are an ALTA Standard user who needs to use time-dependent stress profiles in your analysis, please contact ReliaSoft for information about upgrading to ALTA PRO.
This topic explains several tasks associated with time-dependent stress profiles, including:
A stress profile is a representation of how stress levels will vary with time. It consists of a basic pattern that either repeats as a cycle or occurs once and then continues from its last defined stress setting. To create and save a stress profile, follow the steps below.
To add a new stress profile to your project, choose Insert > Tools > ALTA Stress Profile. A stress profile icon will appear under the Tools heading of the current project explorer, and the Stress Profile window will open. (Stress profiles can also be added from ALTA's SimuMatic Setup window and the ALTA Monte Carlo utility.)
To rename the stress profile, right-click the profile's icon in the current project explorer and choose Rename.
Next, you must define a pattern for how stress levels will change over a specified period of time. The pattern you will define consists of a series of segments, where each segment has a specified duration and either:
a constant stress value, or
a function that takes a time value and returns a stress value.
These segments are defined in the data sheet, as shown next.

Segment Start is calculated automatically by the software and cannot be entered manually. The first segment's start time is always 0. For every subsequent segment, the start time is identical to the prior segment's end time.
Segment End allows you to enter the end time for each segment, which must be smaller than the end time of the next segment.
Stress S(t) is the stress value or function for the segment. If the stress level will stay constant during a segment, enter a constant stress value (e.g., 30). If the stress level will change during a segment, enter the stress as a function of time (e.g., at time = 20, the function t + 20 will return a stress value of 40). When entering a function, you must use t or T as the time variable.
Tip: Because stress units (e.g., volts) and time units (e.g., hours) are not defined in the stress profile, it is important to apply stress profiles only to folios that are intended to use the same stress and time units. In the Stress Profile window, you may want to rename column headers (by double-clicking inside the header) or use the Comments page as a reminder of which units are applicable to that profile. You can also create sub-folders under the Tools heading in the current project explorer to organize your profiles in a way that will make them easier to manage for future use.
For example, suppose the stress unit is psi and the time unit is seconds. Now suppose you wanted to define the following 120-second pattern: a stress value of 30 psi for 60 seconds, followed by a stress value of 50 psi for 30 seconds, followed by a stress function that begins at 50 psi and gradually decreases at a rate of 1 psi per second for the remainder of the pattern. For this pattern, you could fill out the data sheet as follows:
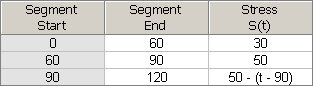
Notice that the last segment of this profile uses a stress function. Since t is the test time (or, if the profile is cyclical, the time since the pattern was last restarted), t = 90 when the last segment begins. So the last segment’s stress level starts at 50 - (90 - 90) = 50. Then, at 91 seconds, the stress level will have dropped to 50 - (91 - 90) = 49. After another second it will have dropped to 50 - (92 - 90) = 48, and so on.
Next, choose the appropriate option in the After Last Segment area of the control panel. Your selection here will determine what happens after the end time of the profile’s last segment (in the above example, after time = 120).
If you select Continue from last stress, all times after the last segment will use the stress value/function defined in the last segment.
If you select Repeat cycle, the entire pattern of segments will be treated as a repeating cycle.
For example, suppose you defined a pattern that is made up of five segments, each an hour long and increasing stepwise from the segment before. The graphs below illustrate the difference between continuing from the last stress (left) and selecting to repeat (right). In this example, the test has a duration of 20 hours, and the graphs explain what would happen through the entire duration of the test.

Before you can use the new stress profile in your analysis, you must save any changes you have made and validate the current profile settings. To do this, click the Validate Stress Profile icon.
![]()
After you save the changes in your profile, the Profile Summary area will appear. Click the area to view a report of the current stress profile in the tool's Results window. For more information, see Results window.
You may also wish to view a graphical representation of your profile. To do this, click the Plot icon to save any profile changes and view a stress vs. time plot. See Plots for general information on plots.
Note: Clicking the Validate Stress Profile icon will not automatically update your stress vs. time plot. To make sure your plot reflects the most recent profile information, click the Plot icon.
If desired, you can use the Comments page of the control panel to enter notes or other text that will be saved with the stress profile.
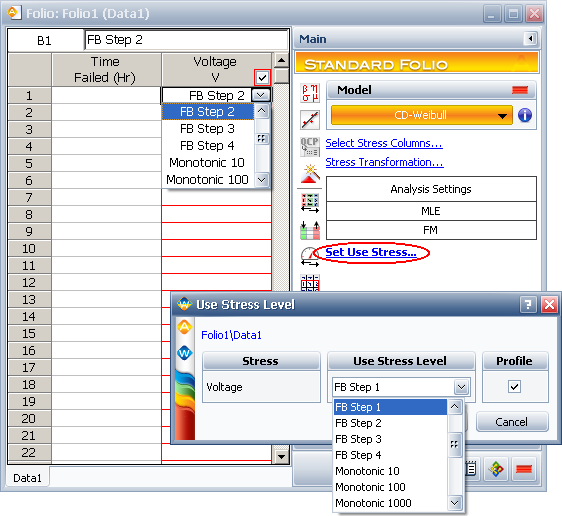
There are two ways stress profiles can be used in the ALTA standard folio. First, they can be used to describe the time-varying stress conditions that sample units will experience during testing (as shown in the data sheet below). Second, they can be used to describe the time-varying stress conditions that the product will experience during normal use (as shown in the Use Stress Level window below).
To describe the test’s stress conditions:
In the ALTA standard folio data sheet, each row represents a tested unit (or group of units). To choose the profile that describes the test conditions for a unit or group, first make sure a cumulative damage life-stress model is selected on the control panel. Then select the cell in the appropriate stress column for the unit or group. A drop-down list will appear in the cell. The list displays all the validated stress profiles in the currently active project.
To describe the product’s use level stress conditions:
Note: Some plots (e.g., the use level probability plot) are not available when you use a stress profile to describe the product's use level conditions.
To choose a stress profile that represents the product's normal operating conditions, first make sure a cumulative damage life-stress model is selected on the control panel. Then click the Set Use Stress link to open the Use Stress Level window. Select the Profile check box for all applicable stresses. The Use Stress Level drop-down list displays all the validated stress profiles in the currently active project.
Note: If you update a stress profile that is associated with an ALTA standard folio, the calculations will not be updated automatically. To update the ALTA standard folio calculations, click the Calculate icon on the control panel.
© 1992-2013. ReliaSoft Corporation. ALL RIGHTS RESERVED.