![]()
![]()
| Related Topics: | ||
The SimuMatic folio gives you access to the data sets generated by the SimuMatic utility and to the results of analyses on those data sets. This topic includes information on various elements of this folio, including:
The Simulation sheet shows the parameters calculated for each data set. It also contains a separate column for each of the calculations that you specified on the Reliabilities and Times tab of the setup window. The following example shows the results for the first ten data sets created with SimuMatic.
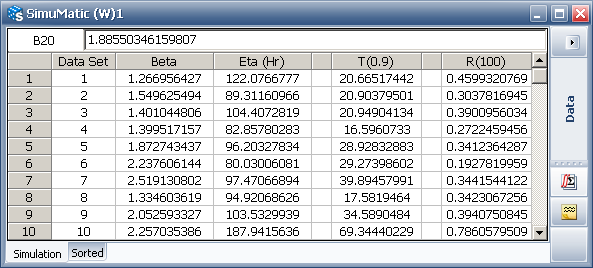
The sheet contains the following columns:
Beta and Eta (Hr) are parameter columns. Parameter columns show the estimated parameters for each data set based on your selected distribution and analysis method. For parameters with an associated unit of measurement (e.g., the Weibull shape parameter eta), the unit will be indicated in the column header.
T(0.9) is a time value column. It displays the time value calculations based on the calculated parameters and a reliability value you entered in the Reliabilities and Times tab of the setup window. In this example, it shows the time at which the product’s reliability is expected to be 0.9, or 90%.
R(100) is a reliability value column. It displays the reliability calculations based on the calculated parameters and a time value you entered in the Reliabilities and Times tab of the setup window. In this example, it shows the reliability value at time = 100.
Note: "N/A" will appear in the parameter columns if there was an error in calculating a particular data set. This is usually an indication that there were not enough failure times in the data set to calculate the parameters.
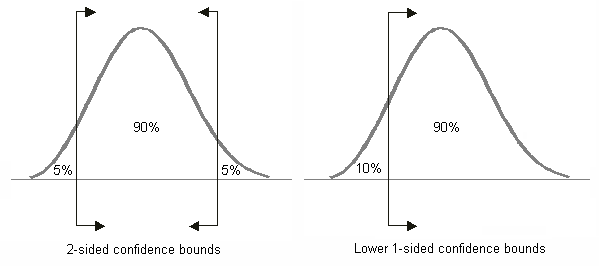
In the Sorted sheet, the calculated values from the Simulation sheet are sorted from least to greatest in order to show the confidence bounds. Assuming all the simulated data sets have calculated parameters, the Percentage column will display the percentage of data sets that are equal to or less than a given data set. So, for example, if you wished to obtain the 90% lower one-sided confidence bound of R(100), you would look up the value of R(100) that corresponds to 10% (i.e., 100% - 90%).

If you wished to obtain the 90% two-sided confidence bounds of R(100), you would look up the values that correspond to 5% (for the lower bound) and 95% (for the upper bound).
This concept is summarized in the figure shown below.
The control panel and its components are described next.
The SimuMatic Setup icon allows you to change your simulation settings and replace your current simulated data sets with new ones.
The Plot icon generates a probability plot of all the data sets.
Transfer Parameters to Selected Folio ![]()
This icon allows you to transfer the calculated parameter values for each simulated data set to an existing Weibull++ standard folio, with one data sheet for each parameter of the model that was used to generate the data. When you click this icon, a window will appear asking whether you want the data sheets to be configured for free-form or times-to-failure data. Then the Transfer Life Data window will appear, where you can select the existing folio that you wish to transfer the calculated parameters to.
Transfer Parameters to New Folio ![]()
This icon creates a new Weibull++ standard folio and transfers the calculated parameter values for each simulated data set to that folio, with one data sheet for each parameter of the model that was used to generate the data. After you click this icon, a window will appear asking whether you want to transfer the data to a data sheet configured for free-form or times-to-failure data. See Weibull++ Standard Folio.
The Distribution area displays the type of distribution that was used to generate each data set.
The Settings area displays what analysis settings were used to analyze the simulated data. Only the Weibull++ version of SimuMatic allows you to change these settings. See Weibull++ Analysis Settings.
The Analysis Summary area displays the parameters that were used to generate each data set.
In the Additional Results area of the control panel:
The T(i) (...) button opens a report that displays each data set in its own column or group of columns. Each calculated data set is separated from the others with an empty data sheet column. This report will contain multiple sheets when there are too many data points to fit onto one sheet.
Note: Data sets without enough data points to fit to a model (i.e., those with an "N/A" in the parameter columns of the SimuMatic's data sheet) will not be shown in this report.
The Summary (...) button opens a report that displays the settings used to generate the data. It also displays information about the variation of the parameter values and, if you entered a target reliability on the Test Design tab of the setup window, it will display the results as well.
The following options on the plot sheet are unique to SimuMatic plots. They allow you to control which elements will be displayed on the plot. See Plots for more general information on plot sheets.
Simulation Lines plots the time vs. unreliability line for every simulated data set.
True Parameter Line plots the time vs. unreliability line defined by the parameters of the distribution that was used to generated the simulated data. (These parameters are visible on the control panel of the Simulation sheet.)
Median Line plots the time vs. unreliability line defined by the median parameters of all generated data sets.
Average Line plots the time vs. unreliability line defined by the average parameters of all generated data sets.
CB on Reliability and CB on Time show confidence bounds on the plot. The percentile of the confidence bounds is determined by what you entered for Confidence Bounds on Plot on the Analysis tab of the setup window.
For example, if you entered 90% in the setup window and selected CB on Time, then the displayed confidence bounds would mark the simulated time values at the 10th (90% lower bound) and 90th (90% upper bound) percentile for every given reliability value.
Target is available only if you have specified a target reliability on the Test Design tab of the setup window. This option marks the target reliability as a point at the intersection of a horizontal line drawn at the target unreliability and a vertical line drawn at the target time.
© 1992-2013. ReliaSoft Corporation. ALL RIGHTS RESERVED.