![]()
![]()
| Related Topics: | ||
The Plot Wizard is used in conjunction with Word report templates and generates a variety of plots based on your inputs and, when applicable, a referenced analysis. To open the Plot Wizard, choose Home > Report > Plot Wizard. You can also click the Plot Wizard icon on the Word report template’s control panel.
![]()
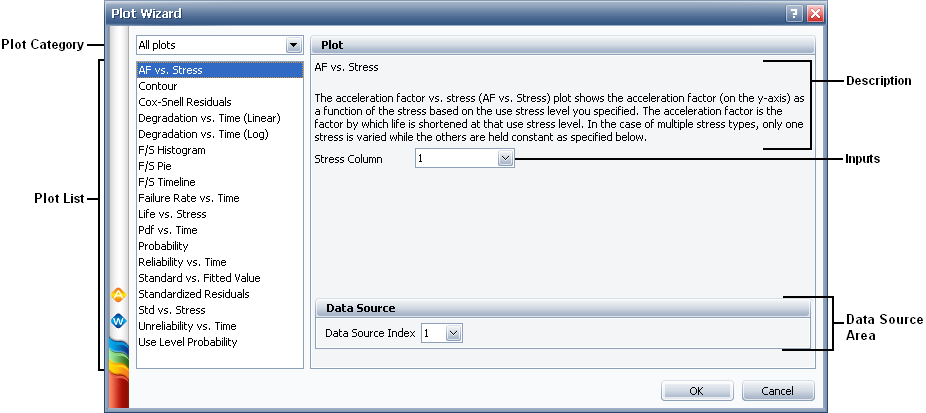
The Plot Wizard window with its components is shown next.
To add a plot using the Plot Wizard, follow the steps below:
Weibull++ and ALTA plots:
Common plots, which can be used with any applicable folio (e.g., the Failure Rate vs. Time plot and the Reliability vs. Time plot).
Weibull++ plots, which can be used with any applicable Weibull++ folio (e.g., the Contour plot and the F/S Pie plot).
ALTA plots, which can be used with any applicable ALTA folio (e.g., the Cox-Snell Residuals plot and the Use Level Probability plot).
Degradation plots, which can be used with any degradation folio, are the Degradation vs. Time (Linear) plot and the Degradation vs. Time (Log) plot.
BlockSim plots:
Analytical System plots, which can be used with any analytical diagram (e.g., the Failure Rate vs. Time plot and the Pdf vs. Time plot).
Analytical Metrics plots, which is the Static RI plot that can be used with any analytical diagram.
Simulation System plots, which can be used with any simulation diagram (e.g., the Mean Availability plot and the System Failures plot).
Simulation Metrics plots, which can be used with any simulation diagram (e.g., the RS DECI plot and the RS FCI Tableau plot).
The Plot List displays the available plots in alphabetical order based on your selection in the plot category drop-down list.
© 1992-2013. ReliaSoft Corporation. ALL RIGHTS RESERVED.