![]()
![]()
| Related Topics: | ||
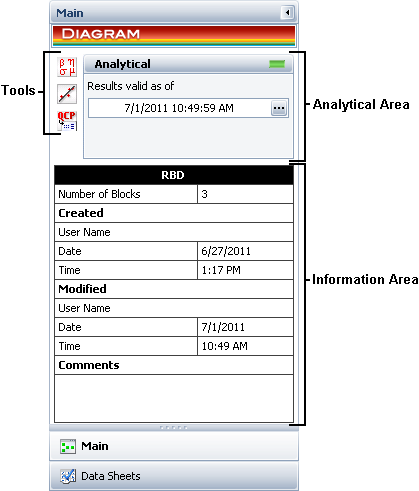
The diagram control panel is arranged into groups of related tasks. Each group has its own page in the control panel. Along the bottom of the control panel are icons you can use to navigate to each page, as shown below.
Tip: There is a horizontal splitter bar directly above the Main button. If you drag it as far up as it will go, all of the pages of the panel will be accessed by large buttons. If you drag it all the way down, all of the pages will be accessed by small icons. Positions in between allow you to use some large buttons and some small icons. See Control Panels.
A description of the settings in the control panel follows.
The Main page, which is shown above, allows you to analyze and plot the diagram and also displays the status and information about the diagram and its blocks. It consists of the following sections:
The Analytical area displays the status and results of the analysis.
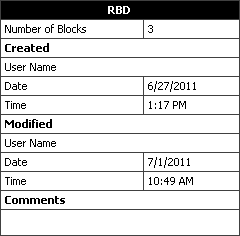
The Information area displays information for the diagram or for the selected block in the diagram. If a block is not selected in the diagram, the Information area will display the number of blocks (i.e., standard blocks, node blocks and/or connector blocks) and/or annotations in the current diagram, as well as the user name, date and time for the diagram’s creation and last modification. You can also click the Comments title to add comments on the diagram that will be displayed here.
If a block is selected in the diagram, information for the selected item will appear in this area. This information will vary depending on the type of item that is selected. The Information area for a standard block is shown next.
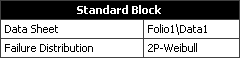
Data Sheet displays the folio and data sheet that the block represents.
Failure Distribution displays the distribution used to calculate the data sheet.
Distribution displays the distribution used to calculated the data sheet.
For a junction block, no information is displayed.
For a node block, the Paths In field displays the number of required paths.
The Tools area gives you quick access to the tools you will need to analyze the diagram and generate additional results.
The Data Sheets page contains a list of all of the data sheets in the project that are available for use in the diagram. This includes any data sheet in any Weibull++ or ALTA standard folio, as long as it has been calculated and is not using one of the competing failure modes distributions.
The Analytical area of the control panel displays the status and results of the analysis.
Status: If the light is green, then the diagram has been analyzed. If the light is red, then the diagram has not been analyzed. An analyzed diagram will remain in the analyzed state unless a change is made to the structure of the diagram (e.g., a block is added or changed, a connector is removed, etc.).
Show Algebraic Solution (...) displays the algebraic solution for the diagram in the Equation Viewer.
The tools frequently used in diagrams are:
Analyze
![]() Analyzes the relationships of the components in the diagram and puts the reliability-wise configuration into a mathematical formula.
Analyzes the relationships of the components in the diagram and puts the reliability-wise configuration into a mathematical formula.
Plot
![]() Creates a plot based on the analysis results. Clicking the Plot icon before the diagram has been analyzed will automatically perform the analysis and then plot the data.
Creates a plot based on the analysis results. Clicking the Plot icon before the diagram has been analyzed will automatically perform the analysis and then plot the data.
QCP
![]() Opens the Quick Calculation Pad (QCP), which allows you to obtain reliability results based on the algebraic solution for the diagram. Clicking the QCP icon before the diagram has been analyzed will automatically perform the analysis and then open the QCP.
Opens the Quick Calculation Pad (QCP), which allows you to obtain reliability results based on the algebraic solution for the diagram. Clicking the QCP icon before the diagram has been analyzed will automatically perform the analysis and then open the QCP.
© 1992-2013. ReliaSoft Corporation. ALL RIGHTS RESERVED.