![]()
![]()
| Related Topics: | ||
When you analyze a diagram, the software analyzes the relationships of the components and puts the reliability-wise configuration into a mathematical formula. The result of this system analysis is used to obtain reliability calculations and plots. The Equation Viewer displays the mathematical formulation of the system relationships in addition to a legend with the failure distribution for each block in the diagram.
To open the Equation Viewer, click the Show Algebraic Solution (...) icon on the control panel.
In the Equation Viewer there are two ways to view the system reliability equation: as a symbolic equation or as the complete equation. When you are using the symbolic equation view, you can choose to view the reliability equation, the pdf equation or the failure rate equation for the system. The symbolic equation uses tokens to represent portions of the equation. If you use the symbolic equation view, you should read the solution from the bottom up, replacing any occurrences of a particular token with its definition. For example, consider the RBD shown next.
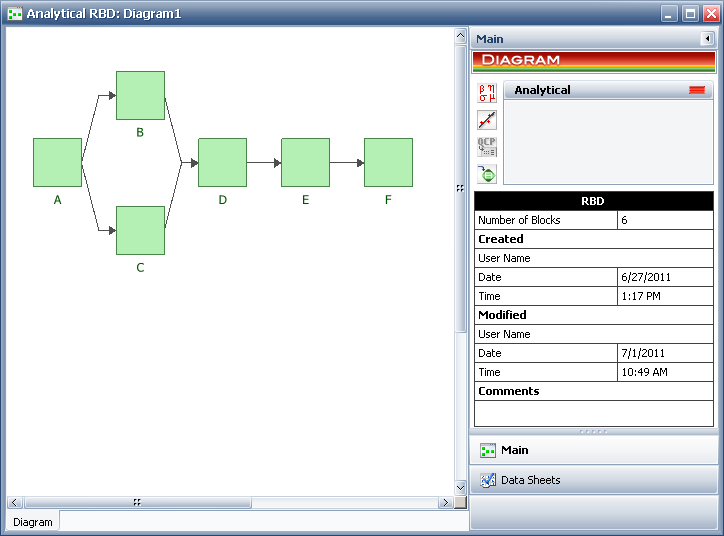
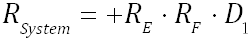
When this diagram is analyzed, the symbolic reliability equation is:
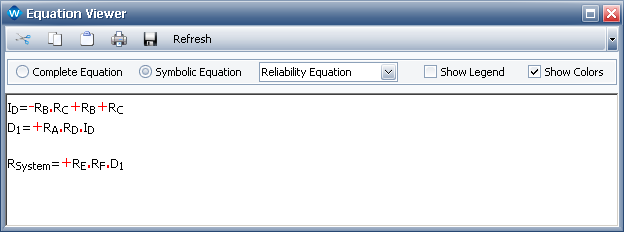
This would be read as follows:
|
|
(1) |
|
|
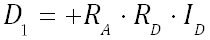
(2) |
|
|
(3) |
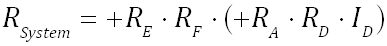
We begin with Eqn. (3). This equation contains the token D1, which is defined in Eqn. (2). This is then substituted into Eqn. (3), yielding:
|
|
(4) |
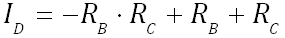
Now Eqn. (4) contains the token ID, which is defined in Eqn. (1). Substituting this into Eqn. (4) yields:
|
|
(5) |
When you use the complete equation view, the software automatically performs all token substitutions. In this view, you can view only the system reliability equation; the pdf equation and the failure rate equation are not available. You should be aware that in some cases, the software may not be able to render the complete equation in the Equation Viewer even though it has internally computed it. This could happen if the memory available on your computer is insufficient and is therefore unable to construct the equation algebraically. This usually does not happen unless there are over one million terms.
Select Show Legend to display the reliability characteristics for each block within the analyzed diagram. Select Show Colors to use color-coding in the window to make the equations easier to view.
The following icons are available in the Equation Viewer’s toolbar:
Cut
![]() Cuts the selected text to the Clipboard. Data stored on the Clipboard can be pasted into this and other applications.
Cuts the selected text to the Clipboard. Data stored on the Clipboard can be pasted into this and other applications.
Copy
![]() Copies the selected text to the Clipboard. Data stored on the Clipboard can be pasted into this and other applications.
Copies the selected text to the Clipboard. Data stored on the Clipboard can be pasted into this and other applications.
Paste
![]() Pastes the contents of the Clipboard to the current control.
Pastes the contents of the Clipboard to the current control.
![]() Sends the current document to the printer.
Sends the current document to the printer.
Save
![]() Saves the equation to a rich text file (*.rtf).
Saves the equation to a rich text file (*.rtf).
If you have made any changes to the Equation Viewer’s display settings (i.e., the type of equation to be displayed, the display of the legend and/or whether to use color-coding in the window), click the Refresh button to update the contents of the window.
© 1992-2013. ReliaSoft Corporation. ALL RIGHTS RESERVED.