![]()
![]()
| Related Topics: | ||
![]()
In many cases, it is possible for failures to occur immediately at the beginning of the life of the unit. These types of failures are known as out-of-the-box failures, or zero-time failures, and they apply to products that failed quality inspections prior to shipping or were damaged during shipping and then returned within the same period they were sold.
To include zero-time failures in the Nevada chart warranty analysis, select the check box during setup and set the return start date to be the same as the sales start date, as shown in the next example.
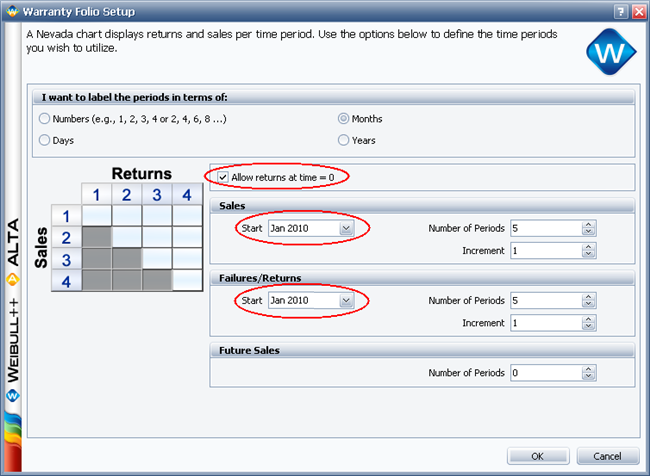
When you enable this setting and click OK, the Returns sheet will allow you to enter returns for the same month in which the units were in-service, as shown next.
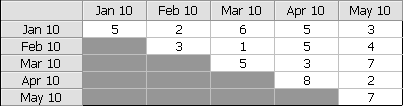
In this example, 5 units from the January sales were damaged during shipping and so were returned within the January sales period. These 5 failures will be treated as zero-time failures. In February, 3 units were also returned within the February sales period. These 3 failures are also zero-time failures. The rest of the chart can be read in a similar manner.
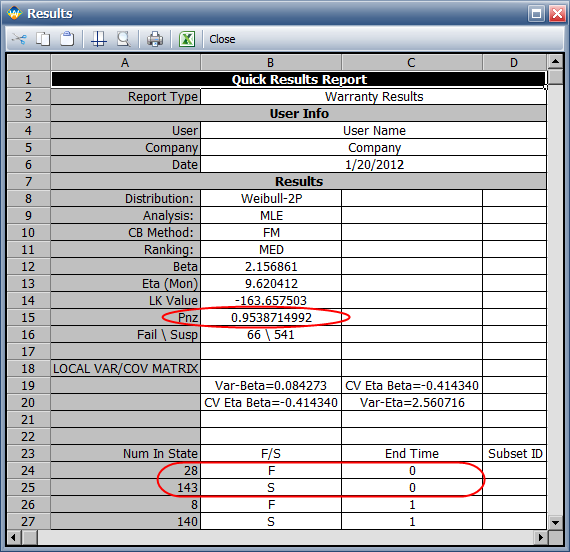
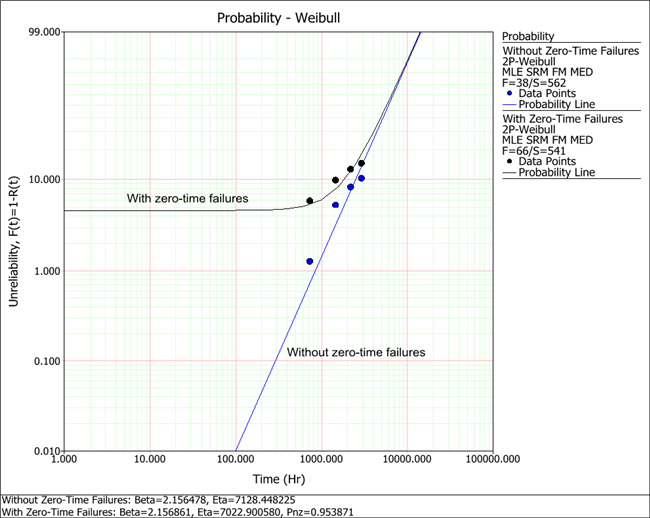
When you calculate the parameters and view the results in the Results window, the converted data set will contain a certain number data points with failures at time = 0, as shown next. Pnz represents the proportion of the population with non-zero failure times. In this sample report, the percentage of the population with non-zero failure times is approximately 95.3871%.
The distribution parameters are calculated without the zero-time failures but any subsequent reliability calculations for the full data set will be multiplied by the Pnz value, such that:
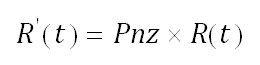
where R’(t) is the reliability function for the entire data set and R(t) is the reliability function for the data set without the zero-time failures. Therefore, when Pnz is equal to 1, all the failures are assumed to occur after time = 0.
The following overlay plot illustrates the effect of the Pnz value on the reliability function. The straight line is the unreliability function for the set of non-zero failure and suspension times. The inclusion of the zero-time failures causes the unreliability function to curve towards the value of unreliability at time = 0, which is 1-Pnz.
When you use the Quick Calculation Pad (QCP), the reliability, unreliability and probability density calculations of the entire data set are influenced by the value of Pnz, while the conditional reliability and failure rate functions are not affected.
© 1992-2013. ReliaSoft Corporation. ALL RIGHTS RESERVED.