
| Related Topics: | ||
In addition to working with data strictly within BlockSim, you can use BlockSim to expand upon analyses performed in other Synthesis-enabled applications via the failure modes and reliability analysis (FMRA). This analysis allows you to:
Display, for the current project, the system hierarchy and Failure Modes and Effects Analysis (FMEA) records that could have an impact on system reliability/maintainability. This includes anything that could cause an item to fail to perform one of its intended functions or cause the failure of one of its sub-items. For more information about FMEAs, see "FMEAs" in the Xfmea or RCM++ help file.
View and set the reliability/maintainability properties of these records and manage their reliability-wise configuration in relation to each other.
If necessary, add and/or delete records from the FMRA.
Perform various reliability, availability and cost calculations.
The FMRA view can be enabled by choosing View > FMRA > Show FMRA. This command toggles the FMRA view on and off.
![]()
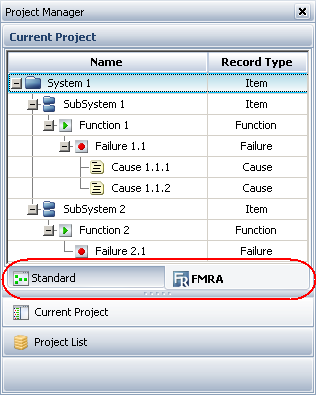
After the FMRA view is enabled, the current project explorer in the Project Manager will have two tabs, as shown next.

The Standard tab shows all standard BlockSim diagrams and other analyses, while the FMRA tab shows only those diagrams associated with the FMRA.
The FMRA hierarchy displays all of the items in the system hierarchy, in addition to any functions, failures and causes that have been defined for those items. All of these records are arranged in a tree-like configuration like the one shown above. Note that each branch of the tree displays items and FMEA records down to the level at which the reliability is defined. In the example shown here, an FMEA has been created for SubSystem 1, and both cause records have URDs assigned to them, defining their probability of occurrence. SubSystem 2 also has an FMEA, but in that case the URD is assigned at the failure level. Although cause records may be associated with that failure record, they are not shown because the reliability is calculated based on the URD assigned to the failure record.
When items or records are added to the current FMRA in Xfmea/RCM++, they will not be displayed in the FMRA hierarchy until you do one of two things:
Choose View > Refresh > Refresh to refresh the FMRA hierarchy. No associated diagrams or blocks will be created. You will not be able to open the new items/records as diagrams until you synchronize the FMRA.
![]()
Choose FMRA > Refresh > Synchronize FMRA to refresh the FMRA hierarchy and create the associated diagrams and blocks.
![]()
Changes that are made in BlockSim are synchronized and propagated to Xfmea/RCM++ automatically, although you may need to refresh the view in Xfmea/RCM++ to see them.
You can choose View > FMRA > Disassociate FMRA to delete all of the diagrams and blocks associated with the current FMRA hierarchy and close the FMRA view.
![]()
Note that you can subsequently re-open the FMRA view, but none of the records will be synchronized with Xfmea/RCM++ and there will not be any associated diagrams or blocks. You can resynchronize at any time.
IMPORTANT: The diagrams that you work with from within the FMRA view are distinct from the BlockSim diagrams in the project. FMRA diagrams relate to the analysis being performed in the project using Xfmea/RCM++. They are accessible only via the FMRA view, while all other diagrams are accessible only from the Standard tab of the current project explorer.
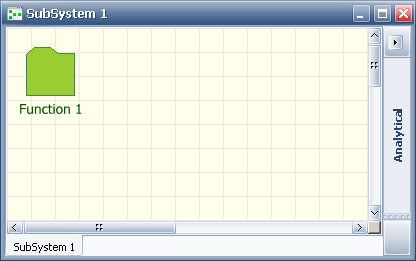
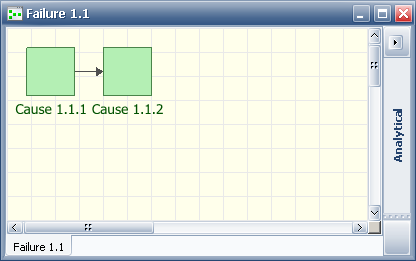
Each item and record in the FMRA hierarchy represents a reliability block diagram, with the exception of the lowest-level item in each branch, which represents a block in the parent diagram. The levels of the hierarchy are expressed using subdiagrams. For example, consider the FMRA hierarchy shown above. Specifically, let's look at the branch of the FMRA that begins with SubSystem 1. The associated FMRA diagrams are:


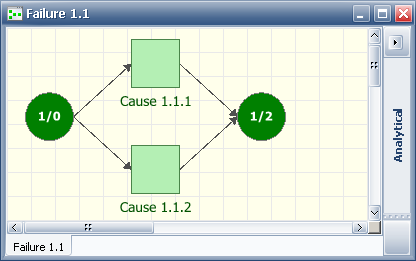
As you can see, the causes are assumed to be in a series configuration, as is the case with all reliability-wise configurations built in Xfmea/RCM++. Working with the FMRA in BlockSim allows you to change the reliability-wise configuration. For instance, let's imagine that the causes are actually in a parallel configuration-- in other words, item failure will not happen if either Cause 1.1.1.1 happens OR Cause 1.1.1.2 happens, but rather if both happen. To represent this, you would change the Failure 1.1 diagram as follows:

By default, the FMRA diagrams are created as analytical diagrams. You can choose FMRA > Inheritance > Toggle Diagram Type to change them to simulation diagrams (or to change simulation diagrams to analytical diagrams. This command changes all of the FMRA diagrams in the project; you cannot have both analytical and simulation FMRA diagrams in the same project. You can analyze or simulate an FMRA diagram just as you would any other RBD, and can generate plots and QCP results for each diagram. You also can perform analytical calculations or simulation at the FMRA level.
You can change the level at which the reliability is defined.
For any item or record that currently inherits its reliability information from a lower level item or record (i.e., any subdiagram block in a diagram), you can select it in the FMRA hierarchy or select the block in the diagram and choose FMRA > Inheritance > Define at This Level. The block in the diagram will change from a subdiagram block to a standard block; you can then open the Block Properties window and assign a URD to the block.
For any item or record above the cause level that currently has reliability defined, you can select it in the FMRA hierarchy or diagram and choose FMRA > Inheritance > Inherit. You can then add the appropriate item(s) or record(s), either in the FMRA hierarchy or in the new subdiagram, and define their properties.
The FMRA hierarchy contains columns that display calculation results and additional information about each record in the hierarchy. To hide or display columns, right-click the column headers, then click Customize Columns to select which columns you want to display.
The following columns can be displayed:
Name displays the record description/name. This column cannot be hidden.
User Access displays an icon when the record is inaccessible. See also Status Indicators.
If the record is being edited by another user, an In-Use icon ![]() will be displayed. Point to the In-Use icon to display the name of the user who is accessing the item.
will be displayed. Point to the In-Use icon to display the name of the user who is accessing the item.
If you do not have the item permissions needed to edit the record, a Restricted Access icon ![]() will be displayed.
will be displayed.
If the record is locked by an FMEA change log in Xfmea/RCM++, a locked FMEA icon ![]() will be displayed.
will be displayed.
Record Type displays whether the record is an item, function, failure or cause.
Synchronized with BlockSim displays ![]() if the record is being synchronized with an FMRA in Xfmea/RCM++.
if the record is being synchronized with an FMRA in Xfmea/RCM++.
Reliability Policy displays "Inherit" if the record's reliability will be determined by the reliability of its lower-level records. If a universal reliability definition (URD) is assigned directly to the record, this column will display the URD's name instead. If a record has neither an "Inherit" policy nor an assigned URD, then "Default (Not Set)" will be displayed and the software will assume that the reliability of the record is 100%.
Mirror Group displays the name of the mirror group that a cause belongs to, if any. All the causes in a mirror group are treated as one and the same event.
Reliability (Analytical) displays the record's reliability (calculated analytically) at the system's specified operating time.
Probability of Failure (Analytical) displays the record's probability of failure at the system's specified operating time. This is the inverse of reliability (1-R).
Operating Cost displays the total costs that accrued during the simulation time.
Cost per Operating Time displays the operating cost divided by the total operating time.
Note: It is not possible to simulate failure times for components whose reliability is defined by a constant value. Failure times can be simulated only in contexts where reliability is time-dependent. Thus, the calculated operating costs for any component with a constant reliability will be zero. In these situations, it may be advisable to change the model from a constant value to a time-dependent distribution.
Reliability (Simulation) displays the reliability (obtained via simulation) at the end time specified in the simulation settings.
Availability displays the average availability (i.e., uptime divided by operating time). This is a metric that reflects the probability that the item is operational (not failed or undergoing repair) when it is requested for use during the simulation.
RS FCI shows the ReliaSoft Failure Criticality Index for each item. This is a relative index showing the percentage of times a failure of the component caused a system failure (i.e., the number of system failures caused by the component divided by the total number of system failures). Note that this relates only to failures; it does not include every event that could bring the system down (such as routine maintenance).
RS DECI shows the ReliaSoft Downing Event Criticality Index for each item. This is a relative index showing the percentage of times that a downing event of the component caused the system to go down (i.e., the number of system downing events caused by the component divided by the total number of system downing events). Note that this only relates to downing events with a non-zero duration.
RS DTCI shows the ReliaSoft Downtime Criticality Index for each item. This is a relative index showing the contribution of each component's downtime to the system’s downtime (i.e., the system downtime caused by the component divided by the total system downtime).
© 1992-2013. ReliaSoft Corporation. ALL RIGHTS RESERVED.