![]()
![]()
| Related Topics: | ||
![]()
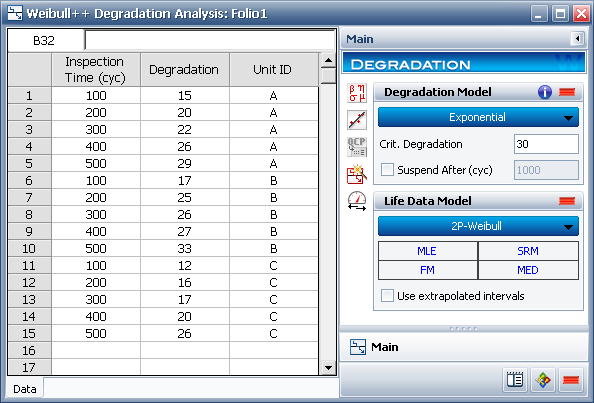
An analyst needs to determine the time when 10% of the turbine blades in a sample are expected to fail (i.e., B10 life). To determine performance, the blades are tested for crack propagation. The units are cyclically stressed and inspected every 100,000 cycles for crack length. Failure is defined as a crack length of 30mm or greater. The following table shows the results.
| Cycles (x1000) | Unit A | Unit B | Unit C |
| 100 | 15 mm | 17 mm | 12 mm |
| 200 | 20 mm | 25 mm | 16 mm |
| 300 | 22 mm | 26 mm | 17 mm |
| 400 | 26 mm | 27 mm | 20 mm |
| 500 | 29 mm | 33 mm | 26 mm |
Using degradation analysis, project the failure times for the blades using an exponential model for the extrapolation, and then calculate the reliability of the blades at a 90% confidence level.
The first step is set up the data sheet for the analysis. Click the Change Units icon on the Main page of the control panel.
![]()
In the Change Units window, select to change the time units to Cycles.
Next, enter the information from the table in the degradation analysis folio.
On the control panel, select the Exponential degradation model and enter a value of 30 for the Critical Degradation.
For the life data model, select the 2-P Weibull distribution and the MLE analysis method. Use the default settings for all other options, as shown next.
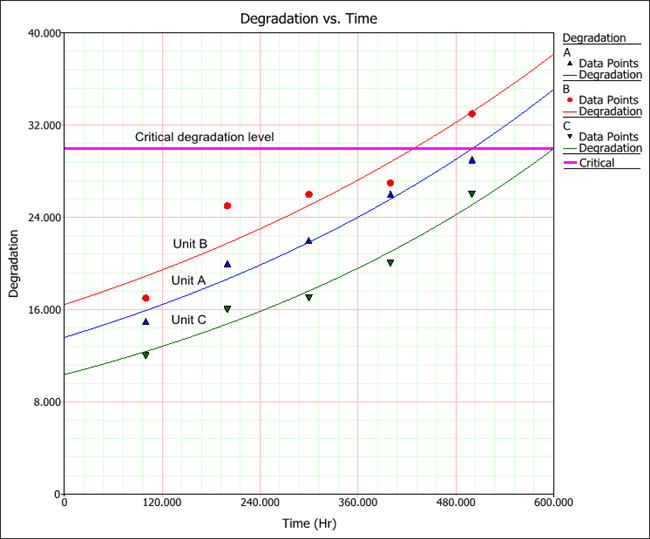
Click Calculate. To view a plot of the results, click the Plot icon on the Main page of the control panel.
The Degradation vs. Time (Linear) plot shows that unit B is expected to reach the critical degradation level first, compared to the other units.
To view the times when the units will reach the critical degradation level, return to the data sheet of the folio. On the control panel, click the Degradation Results (...) button. The parameters of the degradation model for each unit ID are displayed in the first data sheet of the Results window while the extrapolated failure times for all units are displayed in the second sheet, as shown next.

To view the results of the life data analysis, close the Results window and click the Life Data Results (...) button on the control panel. The parameters are estimated to be beta = 8.0722 and eta = 541.4229.
The next step is to estimate the time when 10% of the blades in the sample are expected to fail. Close the Results window and click the QCP icon on the control panel. In the QCP, choose to calculate the BX% Life. Select Cycles for the units and enter a value of 10 in the BX% Life At field. Click Calculate to obtain the results, as shown next:

The results indicate that 10% of the turbine blades will have failed (i.e., B10 life) at approximately 409,698 cycles of operation.
© 1992-2013. ReliaSoft Corporation. ALL RIGHTS RESERVED.