![]()
![]()
| Related Topics: | ||

An automotive manufacturer collected warranty returns and sales data for a vehicle part. The objective is to obtain the percentage of sold vehicles that will need repair under warranty if this particular part has a warranty coverage of 36,000 miles.
The manufacturer has been documenting the mileage accumulation per year for this type of product across the customer base in comparable regions for many years. Based on the data, it was determined that the yearly usage follows a lognormal distribution with a mean = 9.38 and a standard deviation = 0.085. For the interval width, the manufacturer decided to specify an interval of 1,000 miles.
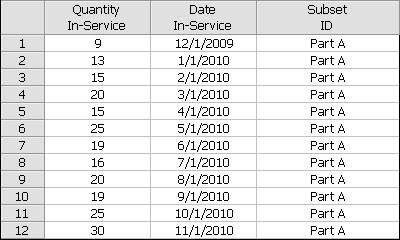
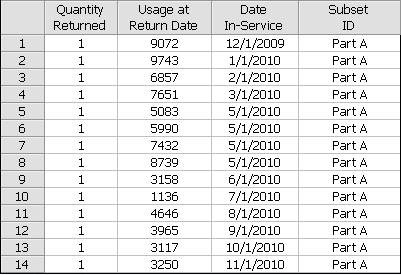
The following is a table of the warranty information for a single year. The information is current as of December 1, 2010.
| Sales Month | Units Sold | Quantity Returned | Usage at Time of Return (miles) |
| 12/1/2009 | 9 | 1 | 9072 |
| 1/1/2010 | 13 | 1 | 9743 |
| 2/1/2010 | 15 | 1 | 6857 |
| 3/1/2010 | 20 | 1 | 7651 |
| 4/1/2010 | 15 | 1 | not available |
| 5/1/2010 | 25 | 1 1 1 1 |
5083 5990 7432 8739 |
| 6/1/2010 | 19 | 1 | 3158 |
| 7/1/2010 | 16 | 1 | 1136 |
| 8/1/2010 | 20 | 1 | 4646 |
| 9/1/2010 | 19 | 1 | 3965 |
| 10/1/2010 | 25 | 1 | 3117 |
| 11/1/2010 | 30 | 1 | 3250 |
The first step is to enter the sales and return data in the usage warranty analysis folio, as follows.
Next, on the Main page of the control panel, set the End of Observation Period date to 12/1/2010.
The next step is to set up the usage distribution. On the Suspensions page of the control panel, make the following input/selections:
Suspension Estimation Method: Usage Distribution
Usage Distribution Period: 1 year
Distribution: Lognormal
Parameters: Log-Mean = 9.38, Log-Std = 0.085
Interval Width: 1000
Next, choose a failure distribution for the vehicle part. On the Main page of the control panel, choose the Lognormal distribution and then select MLE for the parameter estimation method.
Calculate the parameters by choosing Warranty > Analysis > Calculate or click the icon on the Main page of the control panel.
![]()
The parameters of the failure distribution are estimated to be log-mean = 10.5281 and log-std = 1.1352.
Calculate the probability that the vehicle part will fail under warranty. Click the QCP icon on the control panel. In the QCP window, choose to calculate the Probability of Failure. Select Miles for the time units and enter 36,000 for the mission end time.
Click Calculate to obtain the result, as shown next.
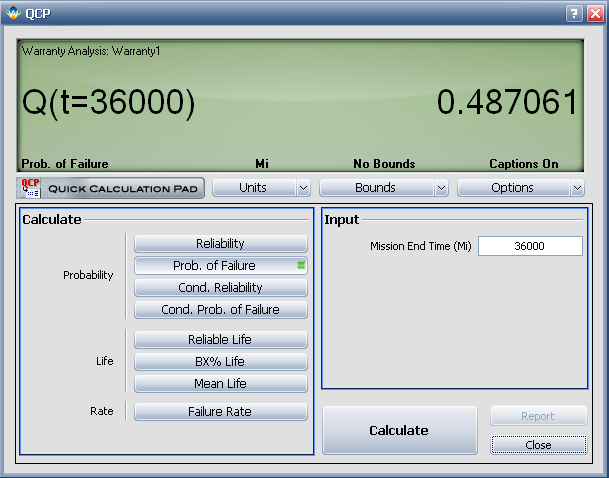
The probability of failure when under warranty is estimated to be 48.71%. In other words, an estimated 48.71% of sold vehicles will return for repair under the current warranty policy. Based on this information, the manufacturer may wish to modify the warranty policy and/or work on improving the reliability of the part.
© 1992-2013. ReliaSoft Corporation. ALL RIGHTS RESERVED.