![]()
![]()
| Related Topics: | ||
![]()
Consider a simple system comprising two components of interest for analysis purposes: a motor and a pump. When the motor fails, the pump also stops operating and the entire system is shut down for repairs. However, when the pump fails, the motor continues to run. The system operates from 8 AM to 5 PM seven days a week.
The following table shows the maintenance log. System monitoring started on January 1, 2010 at 12 PM and stopped on March 18, 2010 at 1 PM. The system had been in operation for some time before the log began but information for events prior to January 1 is not available.
| Event Type | System Failed | System Restored | Component | |||
| Date | Time | Date | Time | |||
| 1 | Failure | Jan-02-10 | 4:00 PM | Jan-02-10 | 7:49 PM | Pump |
| 2 | Maintenance | Jan-09-10 | 8:30 AM | Jan-09-10 | 10:43 AM | Motor |
| 3 | Failure | Jan-10-10 | 9:13 AM | Jan-10-10 | 7:48 PM | Motor |
| 4 | Inspection | Jan-12-10 | 3:26 PM | Jan-12-10 | 6:46 PM | Pump |
| 5 | Failure | Jan-13-10 | 4:56 PM | Jan-13-10 | 5:21 PM | Pump |
| 6 | Maintenance | Jan-15-10 | 1:16 PM | Jan-15-10 | 4:39 PM | Motor |
| 7 | Failure | Jan-20-10 | 1:38 PM | Jan-21-10 | 7:15 PM | Pump |
| 8 | Failure | Jan-25-10 | 10:32 AM | Jan 27-10 | 10:47 PM | Motor |
| 9 | Cleaning | Jan-28-10 | 11:31 AM | Jan-28-10 | 12:00 PM | Pump |
| 10 | Failure | Feb-02-10 | 2:38 PM | Feb-02-10 | 7:11 PM | Motor |
| 11 | Inspection | Feb-08-10 | 3:51 PM | Feb-08-10 | 8:22 PM | Pump |
| 12 | Failure | Feb-12-10 | 4:42 PM | Feb-13-10 | 9:59 AM | Pump |
| 13 | Cleaning | Feb-17-10 | 2:47 PM | Feb-17-10 | 7:13 PM | Motor |
| 14 | Maintenance | Feb-25-10 | 4:31 PM | Feb-25-10 | 5:00 PM | Pump |
| 15 | Failure | Feb-28-10 | 9:00 AM | Feb-28-10 | 3:10 PM | Motor |
| 16 | Failure | Mar-01-10 | 10:16 PM | Mar-01-10 | 10:43 AM | Pump |
| 17 | Inspection | Mar-02-10 | 3:14 PM | Mar-02-10 | 9:11 PM | Pump |
| 18 | Failure | Mar-12-10 | 8:46 AM | Mar-12-10 | 9:20 PM | Motor |
| 19 | Failure | Mar-13-10 | 4:45 PM | Mar-13-10 | 5:13 PM | Pump |
| 20 | Maintenance | Mar-15-10 | 9:36 AM | Mar-15-10 | 10:02 PM | Motor |
The objective is to analyze each component and obtain the failure and repair distributions for all recorded events.
The first step is to set up the event log folio for data entry. On the Other page of the control panel, select the Use OTSF column check box. Clear the check box for the Use System column and then select your preferred format for the date and time.
On the Analysis page of the control panel, select the Prefer RRX if sufficient data option and select all three distributions for consideration. Do this for both the failure and repair distributions.
Next, fill out the data sheet with the event log data.
In the "F=Failure/E=Event" column, mark all the events that are not considered to be actual failures (i.e., maintenance, cleaning and inspections) with an E. Use F for the failures.
In the "OTSF" column, mark all the events attributed to the motor component with a Y because it continues to operate despite a failed pump. The pump, however, will stop accumulating age if the motor fails. In this case, mark all the events attributed to the pump with an N.
Once data entry is complete, go to the Main page of the control panel and make the following selections/inputs:
In the Levels to Analyze area, select Level 1.
In the Failures and Events area, select the Analyze Separately option so that we get separate results for the failures and the general events.
In the System area, enter the date and time the system monitoring started, as well as the date and time the system monitoring ended. Clear the check box for System is new on start date.
Next, enter the shift schedule of the system by choosing Event Log > Actions and Settings > Set Shift Pattern or by clicking the icon on the control panel.
![]()
In the Shift Pattern window, specify 8:00 AM to 5:00 PM shifts seven days a week, as shown next. Click OK.

The following figure shows the completed data sheet and control panel setup.

Next, calculate the results by choosing Event Log > Analysis > Calculate or by clicking the icon on the control panel.
![]()
To view the failure and repair distributions, click the Show Analysis Summary (...) button on the control panel. The following report shows the results.
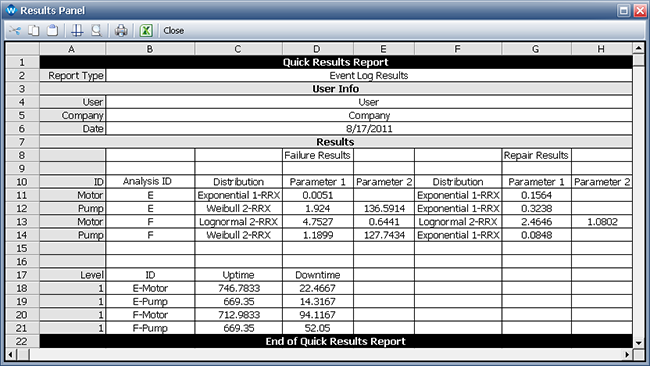
In this example, rows 11 to 14 display the failure and repair distributions for each component due to each type of event. Rows 18 to 21 display the total uptime and downtime for each component due to each type of event.
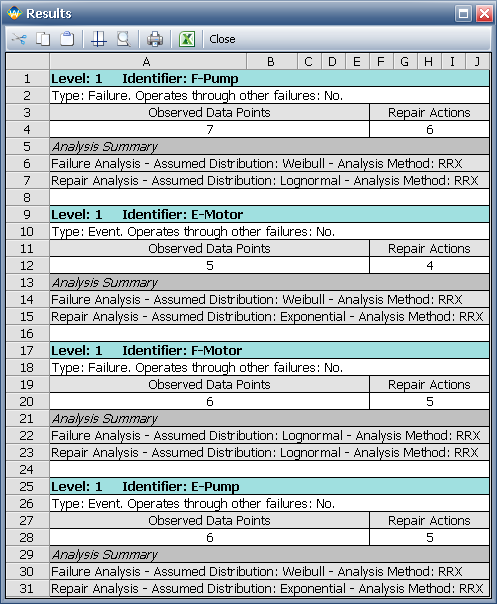
Close the Results window. To view a report on the number of repair actions performed and other results, click the Show Report (...) button on the control panel as shown next.
Close the Results window. You can perform further analysis by transferring the failure/repair data from the event log folio to a Weibull++ standard folio. To do this, choose Event Log > Transfer Life Data > Transfer Life Data to New Folio or click the icon on the control panel.
![]()
This automatically creates a new Weibull++ standard folio within the project. The folio will contain separate data sheets for the failure and repair data. The following data sheet shows the failure data for the motor component.
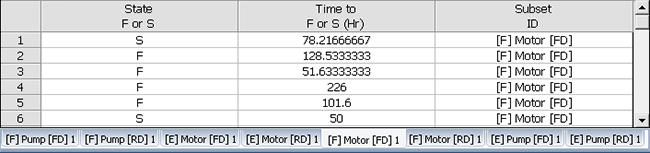
The [F] indicates an analysis of the failures, while [E] is an analysis of the general events (note that a combined analysis would display [C]). The [FD] indicates that the data set is for the failure distribution, while [RD] is the data set for the repair distribution.
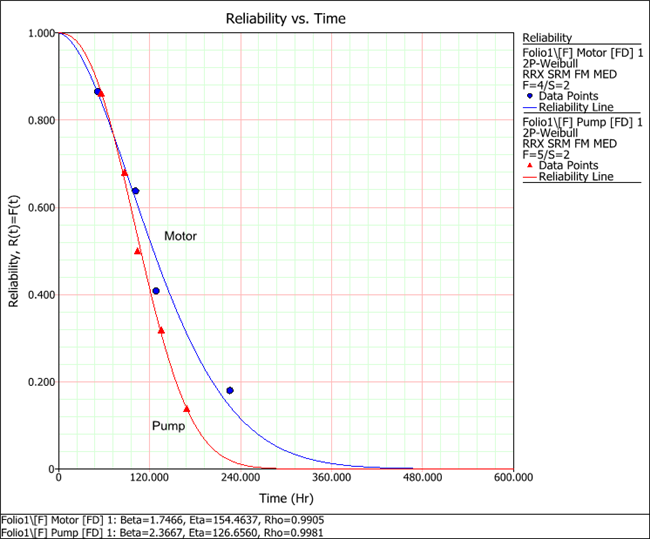
If you were to fit a 2-parameter Weibull distribution to the failure data of the motor and the pump, and then generate an overlay plot, you would be able to visually compare the reliability of the components, as shown next.
© 1992-2013. ReliaSoft Corporation. ALL RIGHTS RESERVED.