![]()
![]()
| Related Topics: | ||
The 3D Plot window contains a contains a control panel, which allows you to customize the axes of the plot. The Weibull++ control panel is shown below to the left and the ALTA control panel is shown below to the right. The respective components are explained next.
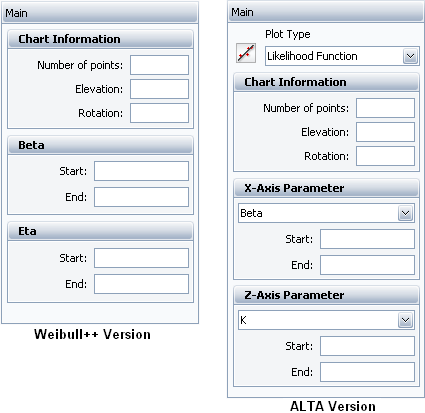
Plot Type 
Select which plot type you want to view in the 3D plot sheet from the drop-down list. The available 3D plots include the likelihood function plot, the pdf plot, the failure rate plot, the reliability plot and the unreliability plot.
Chart Information allows you to customize the resolution, elevation and rotation of the plot.
Number of points sets the resolution for the plot. You must have at least 10 points; however, 40 or more points will result in a slow re-draw.
Elevation measures the rotation in degrees (0°-90°) about the vertical plane.
Rotation measures the rotation in degrees (0°-360°) about the horizontal plane.
Axis Parameters
Allows you to select the parameters that you want the x-axis and the z-axis to represent and to modify the starting and ending values of the axes. The parameters available in the drop-down box will depend on the distribution used to calculate the parameters in the current data sheet.
Start shows the low (starting) value on the axis.
End shows the high (ending) value on the axis.
Axes 
Allows you to modify the starting and ending values of the plot. The starting and ending values of the axes that appear here will depend on the distribution used to calculate the parameters.
Start shows the low (starting) value on the axis.
End shows the high (ending) value on the axis.
For Weibull++ folios, the following table shows the possible values for each of the distributions.
|
Distribution |
Values |
|
Weibull |
Beta, Eta |
|
Normal |
Mean, Std |
|
Lognormal |
Log-Mean, Log-Std |
|
Exponential |
Lambda, Gamma |
|
G-Gamma |
Mean, Std |
|
Gamma |
Log-Mean, Log-Std |
|
Logistic |
Log-Mean, Log-Std |
|
Loglogistic |
Log-Mean, Log-Std |
|
Gumbel |
Log-Mean, Log-Std |
© 1992-2013. ReliaSoft Corporation. ALL RIGHTS RESERVED.