![]()
![]()

The data set used in this example is available in the example database installed with the Weibull++ software (called "Weibull11_Examples.rsgz11"). To access this database file, choose File > Help, click Open Examples Folder, then browse for the file in the Weibull sub-folder.
The name of the project is "Monte Carlo Simulation - User-Defined Equation - Hinge."
A company manufactures hinges that are made up of four components A, B, C and D. The next figure shows a schematic of the hinge's assembly.
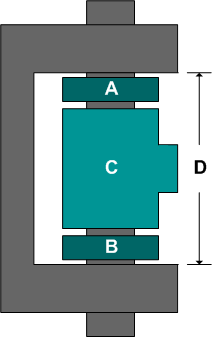
The manufacturer wants to determine the percentage of hinges that would fall out of specifications. Specifically, the manufacturer wants to estimate the probability that (A+B+C) will be greater than D.
For that purpose, data sets were collected for the dimensions of each of the manufactured components. Of each of the components A, B, C and D, seven units were taken from the assembly line and the following measurements were recorded.
Dimensions for A (cm) |
Dimensions for B (cm) |
Dimensions for C (cm) |
Dimensions for D (cm) |
2.0187 |
1.9795 |
30.4216 |
33.6573 |
1.9996 |
2.0288 |
29.9818 |
34.5432 |
2.0167 |
1.9883 |
29.9724 |
34.6218 |
2.0329 |
2.0327 |
30.192 |
34.7538 |
2.0233 |
2.0119 |
29.9421 |
35.1508 |
2.0273 |
2.0354 |
30.1343 |
35.2666 |
1.984 |
1.9908 |
30.0423 |
35.7111 |
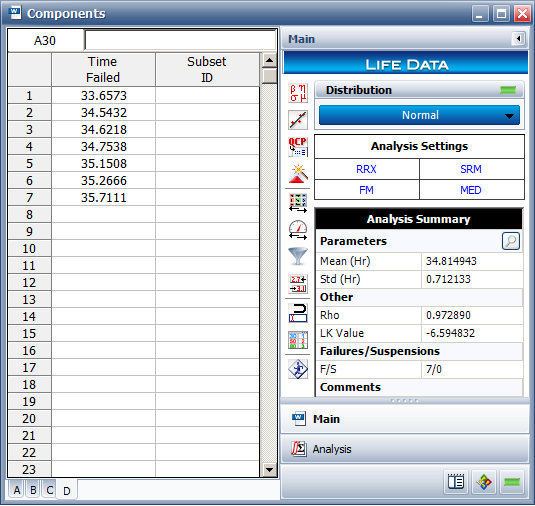
The first step in this analysis is to model the dimensions of each of the parts using the recorded data. To do this, create a Weibull++ life data folio configured for times-to-failure. Name this folio “Components.” Then enter the dimension measurements into the new folio with a separate data sheet for each component.
Next, analyze each data set assuming a normal distribution and RRX as the analysis method. Below is the “Components” folio with the analysis results for component D displayed. After the parameters for each data set are calculated, Monte Carlo simulation can be performed to estimate the probability that (A+B+C) will be greater than D.
Choose Insert > Simulation > Monte Carlo. (If you have ALTA activated on your computer, you will be given a choice between "Monte Carlo" or "Stress-Dependent Monte Carlo." Choose Monte Carlo.)
In the Distribution area on the Main tab, choose User-Defined for the distribution and click the Insert Data Source button to insert the first data sheet from the “Components” folio. Click the button again to insert the second data sheet, and repeat until all four data sheets are entered. Edit the user-defined equation so it appears as shown next.
'Components!A' + 'Components!B' + 'Components!C' - 'Components!D'
In the Data Points area on the Settings tab, enter 1000 for the number of data points. Choose to generate the data set in a new folio and new sheet, then click Generate to create the simulated data.
In the new data sheet that contains the simulated data, calculate the parameters, assuming a normal distribution and RRX as the analysis method.
The following is a pdf plot of the simulated data for (A+B+C-D).
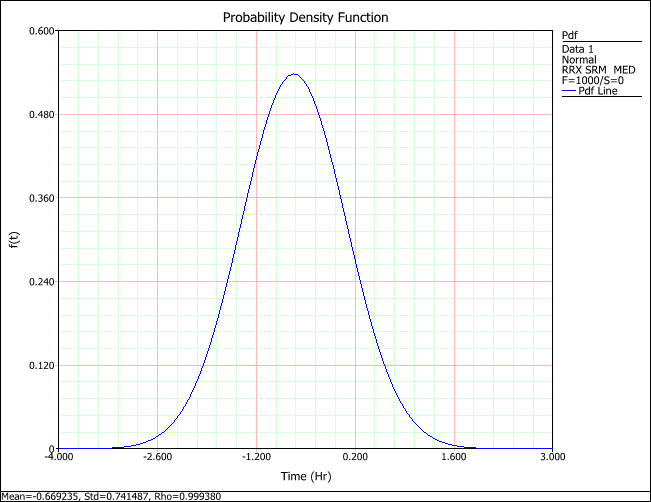
The probability that (A+B+C) > D is equal to the probability that (A+B+C-D) > 0. Thus, the area under the curve of the above pdf from time = 0 to infinity—where “time” is actually the value of (A+B+C-D)—will tell us how likely it is that the product will fall out of specifications (i.e., the likelihood that A+B+C will be greater than D).
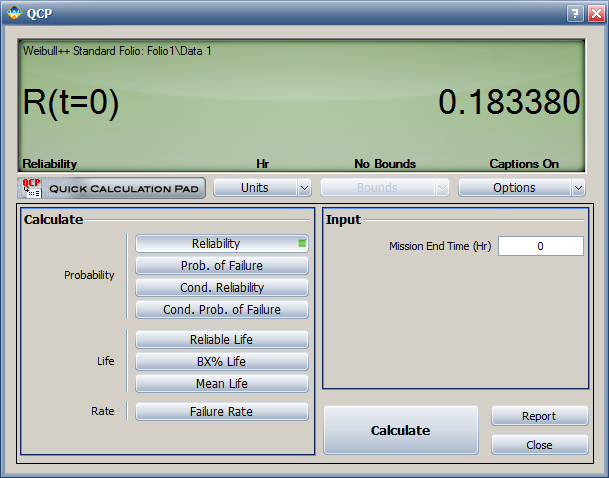
Use the QCP to calculate the probability, as shown next. (Note that we will use the Reliability option in the QCP, even though we are finding the likelihood of falling out of specifications, since the calculation we wish to perform is equivalent to finding the reliability of a randomly generated data set at time = 0.)
The results show that the probability that (A+B+C) will be greater than D is about 18.34%. Note that your results may vary because the data were obtained through simulation.
© 1992-2017. HBM Prenscia Inc. ALL RIGHTS RESERVED.
 |
E-mail Link |