
| Related Topics: | ||
The types of plots available depend on the predictions standard you are working with. This topic provides a list of all the available plots in each prediction standard. To learn how to create and save plots, see Plot Viewer.
For MIL-217 and Bellcore/Telcordia predictions, the available plots are:
The Failure Rate plot compares the failure rate of all sub-items in the selected standard item or block.
The MTBF plot compares the MTBF of all sub-items in the selected standard item or block.
The Unreliability plot compares the unreliability value of all sub-items in the selected standard item or block.
The Mission Phase plot allows you to compare a metric of interest across two or more mission phases. For example, if you choose to plot the failure rate for three mission phases, the plot will compare the failure rates of all sub-items in the system in each mission phase. You can define up to ten mission phases to plot. (See Mission Phase Plots.)
In addition, you can plot any of the metrics above (except mission phase) against any of the following stress factors:
Temperature or Temperature (Delta)
Environment
Current, Power or Voltage Stress
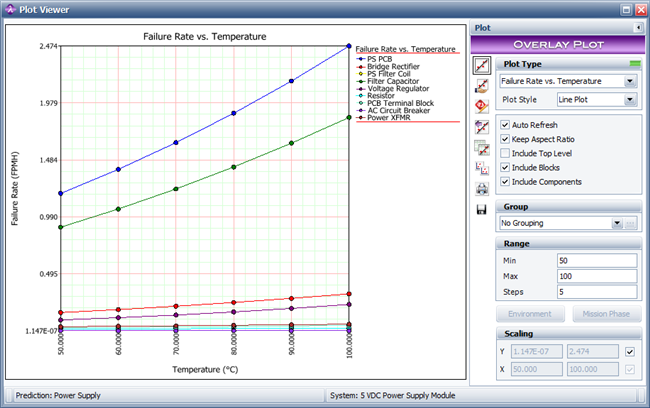
You will need to enter/select the value of the stress factor in the plot sheet's control panel. For instance, if you select to create a Failure Rate vs. Temperature plot, you will need to specify a minimum and maximum range for the temperature, as well as the number of points (or steps) to display on the graph. The following plot shows an example where the temperature range is from 50 to 100 ºC and the number of steps is set to 5.
Note that if you select to plot against environment, you can click the Environment button to specify which environments will be included or excluded in the plot.
For NSWC-07 predictions, the available plots are:
The Failure Rate plot compares the failure rate of all sub-items in the selected standard item or block.
The MTBF plot compares the MTBF of all sub-items in the selected standard item or block.
The Unreliability plot compares the unreliability value of all sub-items in the selected standard item or block.
In addition, you can plot any of these metrics against temperature. Similar to what was described above for MIL-217/Bellcore and Telcordia plots, you will need to specify a minimum and maximum range for the temperature, as well as the number of points (or steps) to display on the graph.
For FIDES predictions, the available plots are:
The Failure Rate plot compares the failure rate of all sub-items in the selected standard item or block.
The Contribution plot compares the contribution made by all sub-items to the failure rate of the selected standard item or block.
The MTBF plot compares the MTBF of all sub-items in the selected standard item or block.
The Factor Contribution by Component block compares the contribution made by each sub-item to the acceleration factors (e.g., thermal cycling factor, mechanical factor, chemical factor, etc.).
The Factor plot compares the failure rate of each sub-item based on the acceleration factors (e.g., thermal cycling factor, mechanical factor, chemical factor, etc.).
The Failure Rate per Phase plot compares the failure rate of the standard item or block in all phases in the life profile.
© 1992-2015. ReliaSoft Corporation. ALL RIGHTS RESERVED.