
A phase diagram, or more specifically a reliability phase diagram, is an extension of the reliability block diagram (RBD) approach. While an RBD is used for a system with a fixed configuration throughout the entire period of operation, a phase diagram can be used to represent scenarios in which a system may undergo changes over time to one or more of the following:
Its reliability configuration
The available repair resources
The failure, maintenance or throughput properties of its individual components.
For example, a manufacturing company's production may be lower during the night shift than during the day shift. Or a system may use different components during different stages of operation, such as an aircraft during taxiing, takeoff, cruising and landing. In these and many other situations, a phase diagram can be configured so that the simulation will account for the differences in the system during different time periods.
The topics in this section address the following:
Using the phase diagram control panel.
Configuring and using blocks in phase diagrams, including:
Assumptions used when simulating phase diagrams.
Available results and plots.
Performing throughput analysis with phase diagrams.
In BlockSim, phase diagrams are built using phase blocks arranged chronologically to represent each sequential stage in the operation of the system. In much the same way that a subdiagram block within an RBD represents another diagram in the current project, operational phase blocks are linked to simulation RBDs that represent the reliability-wise configuration of the system during each operational phase, while maintenance phase blocks are linked to maintenance templates that describe tasks that need to be completed at some point during the system’s operation.
As an example, consider an aircraft with three engines and three landing gear assemblies. The aircraft undergoes five operational phases every time it flies: taxiing, take-off, cruising, landing and taxiing. Each phase is modeled using a simulation RBD.
In a typical mission, the airplane taxies for 15 minutes, takes off for 30 seconds, cruises for 4 hours, lands for 30 seconds and taxies for another 10 minutes. Assume that when a critical failure (system failure) occurs during taxiing, the airplane does not take off and is sent for maintenance instead. However, when a critical failure occurs during take-off, cruising or landing, the system is assumed to be lost.
The phase diagram for this aircraft’s mission might be configured as shown in the following picture, where each phase block is linked to the RBD that describes the reliability-wise configuration of the aircraft during that activity.
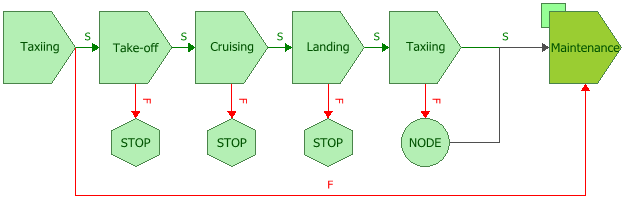
Each of the operational phases in this diagram has two paths leading from it: a success path and a failure path. This graphically illustrates the consequences in each case. For instance, if the first taxiing phase is successful, the airplane will proceed to the take-off phase; if it is unsuccessful, the airplane will be sent for maintenance. The failure paths for the take-off, cruising and landing phases point to stop blocks, which indicate that the simulation of the mission ends. For the final taxiing phase, both the success and failure paths lead to the maintenance path; the node block allows you to model this type of shared outcome.
What’s Changed? In BlockSim 7, there was only one path from each phase. The failure outcome for each phase was defined via a drop-down list. The success and failure paths used in BlockSim 8 make it easy to see what will happen upon success or failure for each block. They also allow you to create more complex phase diagrams, in which success and failure may lead to entirely different sets of phases. In addition, they offer an additional possible outcome of failure. Previously, the outcome of failure could be maintenance, stopping the simulation or continuing the simulation; now, another possible outcome of failure can be continuing simulation on a different path.
For more information about using success and failure paths, please read "Modeling Nonlinear Systems in Reliability Phase Simulation" at: http://www.weibull.com/hotwire/issue135/hottopics135.htm.
The following table summarizes the operational phases and their properties. By applying a duty cycle of 1.5, the take-off and landing phases show that the system will operate at a 50% greater rate than the taxiing and cruising phases. The On System Failure column shows what will happen if a failure occurs during that phase. For example, if there is a system failure during the take-off, the simulation will end (indicating that the system will be lost) and a new simulation will begin. Whereas, if the system failure occurs during the taxiing phase, the system will enter a maintenance phase and may be able to resume the mission when the repairs are complete.
|
Phase Name |
Duration |
Duty Cycle |
On System Failure |
|
Taxiing |
15 minutes |
1 |
Go to the maintenance phase |
|
Take-off |
30 seconds |
1.5 |
End current simulation, start new simulation if applicable |
|
Cruising |
4 hours |
1 |
End current simulation, start new simulation if applicable |
|
Landing |
30 seconds |
1.5 |
End current simulation, start new simulation if applicable |
|
Taxiing |
10 minutes |
1 |
Go to the maintenance phase |
When you simulate the phase diagram, BlockSim will simulate the RBD linked to the Taxiing phase block for the specified period of time and then simulate the RBD linked to the Take-off phase, and so on according to the instructions in the phase diagram.
Most of the techniques for working with objects in a phase diagram, such as selecting blocks within the diagram, copying/pasting blocks and arranging blocks, are the same as the options described for RBDs and fault trees. You can also change the style settings for the blocks and/or diagram.
The ReliaWiki resource portal has more information on phase diagrams at: http://www.ReliaWiki.org/index.php/Reliability_Phase_Diagrams_(RPDs). For additional information on how you might use phase diagrams, please read "Reliability Phase Diagram Analysis" at: http://www.ReliaSoft.com/newsletter/v8i1/phases.htm. (Note that this article uses BlockSim 7, but the theory remains the same.)
© 1992-2013. ReliaSoft Corporation. ALL RIGHTS RESERVED.